RHIhub Data Visualization Help
RHIhub offers interactive maps, charts, and graphs in the Chart Gallery and throughout the site, as well as a Rural Data Explorer with additional features. Learn how to use these data visualizations:
Sitewide Features
Save the image of the map, chart, or graph in PNG format. Three resolutions are available:
- Small - 860 pixels wide, suitable for presentations
- Medium - 1720 pixels wide, good for printing
- Large - 3440 pixels wide, better for book publishing
Allows you to share the visualization on Facebook, X, LinkedIn, and via email.
Get access to the data behind the visualization in CSV format, which can be used by Excel and similar tools.
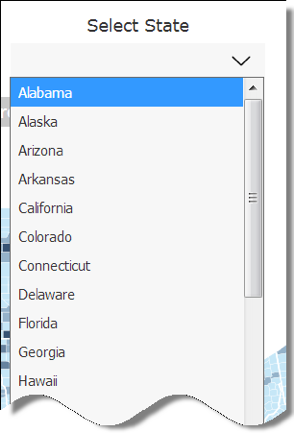
Select the state from the drop-down menu. Available throughout the Data Explorer and for many charts in the Chart Gallery.
Additional Map & Data Explorer Features
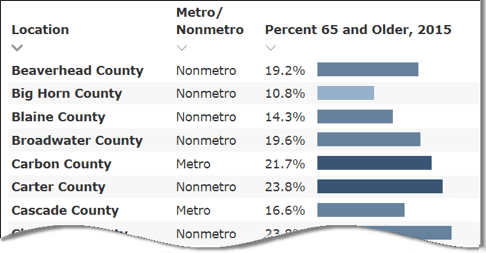
By default, our map visualizations show all counties. Look for these buttons to switch to seeing only Nonmetro or only Metro counties.
All Others: Lower left of visualization
Click on a state to zoom in and access county-level data. To return to the full view of the U.S., click "Back to U.S."
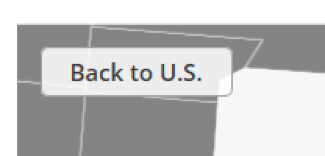
Back to U.S. in upper left of map
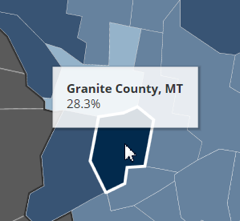
Click a state for a detailed view. Then roll over each county to access county-level data.
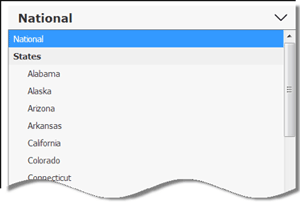
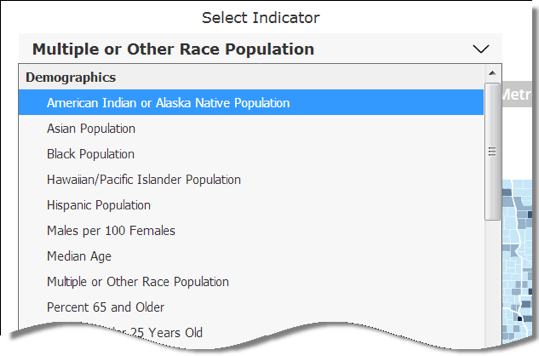
Data Explorer Only. Use the drop-down menu to select among over 50 indicators related to rural health.
Zoom in to a state by selecting it from the drop-down list or clicking on the state.
Use the "Back to U.S." button in the upper left to see the full map.
Back to U.S. in upper left of map
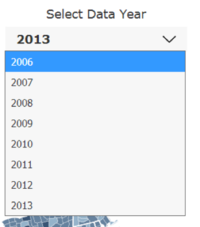
Data Explorer Only. For some indicators, multiple years of data are available. Select from the drop-down menu to change years.
Metro-Nonmetro Classification
RHIhub categorizes counties as metropolitan or nonmetropolitan using the Office of Management and Budget metropolitan and micropolitan statistical area delineations. Nonmetro counties include noncore (small rural) and micropolitan (large rural) counties.
Data Sources
RHIhub uses publicly available federal data. Each data visualization includes data source information in the lower left, which includes a link to the data source and the year of the data.