Rural Health
Resources by Type: Chart/Graph
Population Characteristics Release Updates: Explore the Estimates, County Population by Age, Sex, Race, and Hispanic Origin
Visualization that provides detailed information on each county's age and sex structure and population by race and ethnicity, as well as total county population and median age.
Additional links: A State's Median Age Does Not Tell The Whole Story: New Census Bureau Visualization Shows Broad Variations in Age Structure By State and County
Date: 07/2022
Sponsoring organization: U.S. Census Bureau
view details
Availability of Medical Doctors Favors Metropolitan Areas with Low Rates of Self-Employment
Line chart tracking the number of Medical Doctors (MDs) per 10,000 residents between 1960 and 2017, comparing metro and nonmetro areas of high self-employment and low self-employment. Uses data from the HRSA Bureau of Health Workforce, 2018-19 Area Health Resources File and American Community Survey 2018 5-year data.
Date: 07/2022
Sponsoring organization: USDA Economic Research Service
view details
QuickStats: Age-Adjusted Percentage of Adults Aged ≥18 Years Who Met the 2018 Federal Physical Activity Guidelines for Both Muscle-Strengthening and Aerobic Physical Activity, by Urbanization Level — National Health Interview Survey, United States, 2020
Bar chart showing the percentage of adults meeting physical activity guidelines overall and by urbanization level for large central metro, large fringe metro, medium and small metro, and nonmetropolitan areas.
Citation: MMWR (Morbidity and Mortality Weekly Report), 71(27), 887
Date: 07/2022
Sponsoring organization: Centers for Disease Control and Prevention
view details
QuickStats: Percentage of Adults Aged ≥18 Years with Diagnosed Heart Disease, by Urbanization Level and Age Group — National Health Interview Survey, United States, 2020
Bar chart showing heart disease in metropolitan and nonmetro areas for adults overall and by age group for those 18-44, 45-64, and 65 or older.
Citation: MMWR (Morbidity and Mortality Weekly Report), 71(23), 778
Date: 06/2022
Sponsoring organization: Centers for Disease Control and Prevention
view details
Labor Force Participation Decreased Less in Rural Areas Than in Urban Areas at the Onset of COVID-19 Pandemic
Chart showing U.S. labor force participation in 2007, 2019, 2020, and 2021, with breakdowns by urban and rural location and by age groups 16-24, 25-64, and 65 and older.
Date: 05/2022
Sponsoring organization: USDA Economic Research Service
view details
Chart showing U.S. labor force participation in 2007, 2019, 2020, and 2021, with breakdowns by urban and rural location and by age groups 16-24, 25-64, and 65 and older.
Date: 05/2022
Sponsoring organization: USDA Economic Research Service
view details
QuickStats: Rate of Deaths Attributed to Unintentional Injury from Fire or Flames, by Sex and Urban-Rural Status — National Vital Statistics System, United States, 2020
Bar chart showing the rate of deaths due to unintentional injury from fire or flames by sex for rural and urban areas.
Citation: MMWR (Morbidity and Mortality Weekly Report), 71(14), 529
Date: 04/2022
Sponsoring organization: Centers for Disease Control and Prevention
view details
Bar chart showing the rate of deaths due to unintentional injury from fire or flames by sex for rural and urban areas.
Citation: MMWR (Morbidity and Mortality Weekly Report), 71(14), 529
Date: 04/2022
Sponsoring organization: Centers for Disease Control and Prevention
view details
QuickStats: Death Rates Attributed to Excessive Cold or Hypothermia, by Urbanization Level and Sex — National Vital Statistics System, 2018–2020
Bar chart showing death rates due to cold or hypothermia for women and for men for metropolitan, micropolitan, and noncore (rural) areas.
Citation: MMWR (Morbidity and Mortality Weekly Report), 71(7), 282
Date: 02/2022
Sponsoring organization: Centers for Disease Control and Prevention
view details
Bar chart showing death rates due to cold or hypothermia for women and for men for metropolitan, micropolitan, and noncore (rural) areas.
Citation: MMWR (Morbidity and Mortality Weekly Report), 71(7), 282
Date: 02/2022
Sponsoring organization: Centers for Disease Control and Prevention
view details
SNAP Spending Contributed to Rural Economic Output and Jobs Following the Great Recession
Chart comparing rural and urban economic impacts of the USDA's Supplemental Nutritional Assistance Program (SNAP) during the period of high unemployment from 2009-2014. Uses USDA Economic Research Service data, USDA Food and Nutrition Service data, and 2014 U.S. base level data from IMPLAN Group, LLC.
Date: 02/2022
Sponsoring organization: USDA Economic Research Service
view details
Unemployment Rates are Again at Pre-Pandemic Levels in Rural Counties, Still Higher in Persistently Poor Urban Counties
Chart comparing unemployment rates in rural and urban persistent poverty and non-persistent poverty counties from July 2019-October 2021. Uses data from the USDA Economic Research Service, 2015 County Typology Codes, and data from the U.S. Department of Labor's Bureau of Labor Statistics Local Area Unemployment Statistics program.
Date: 01/2022
Sponsoring organization: USDA Economic Research Service
view details
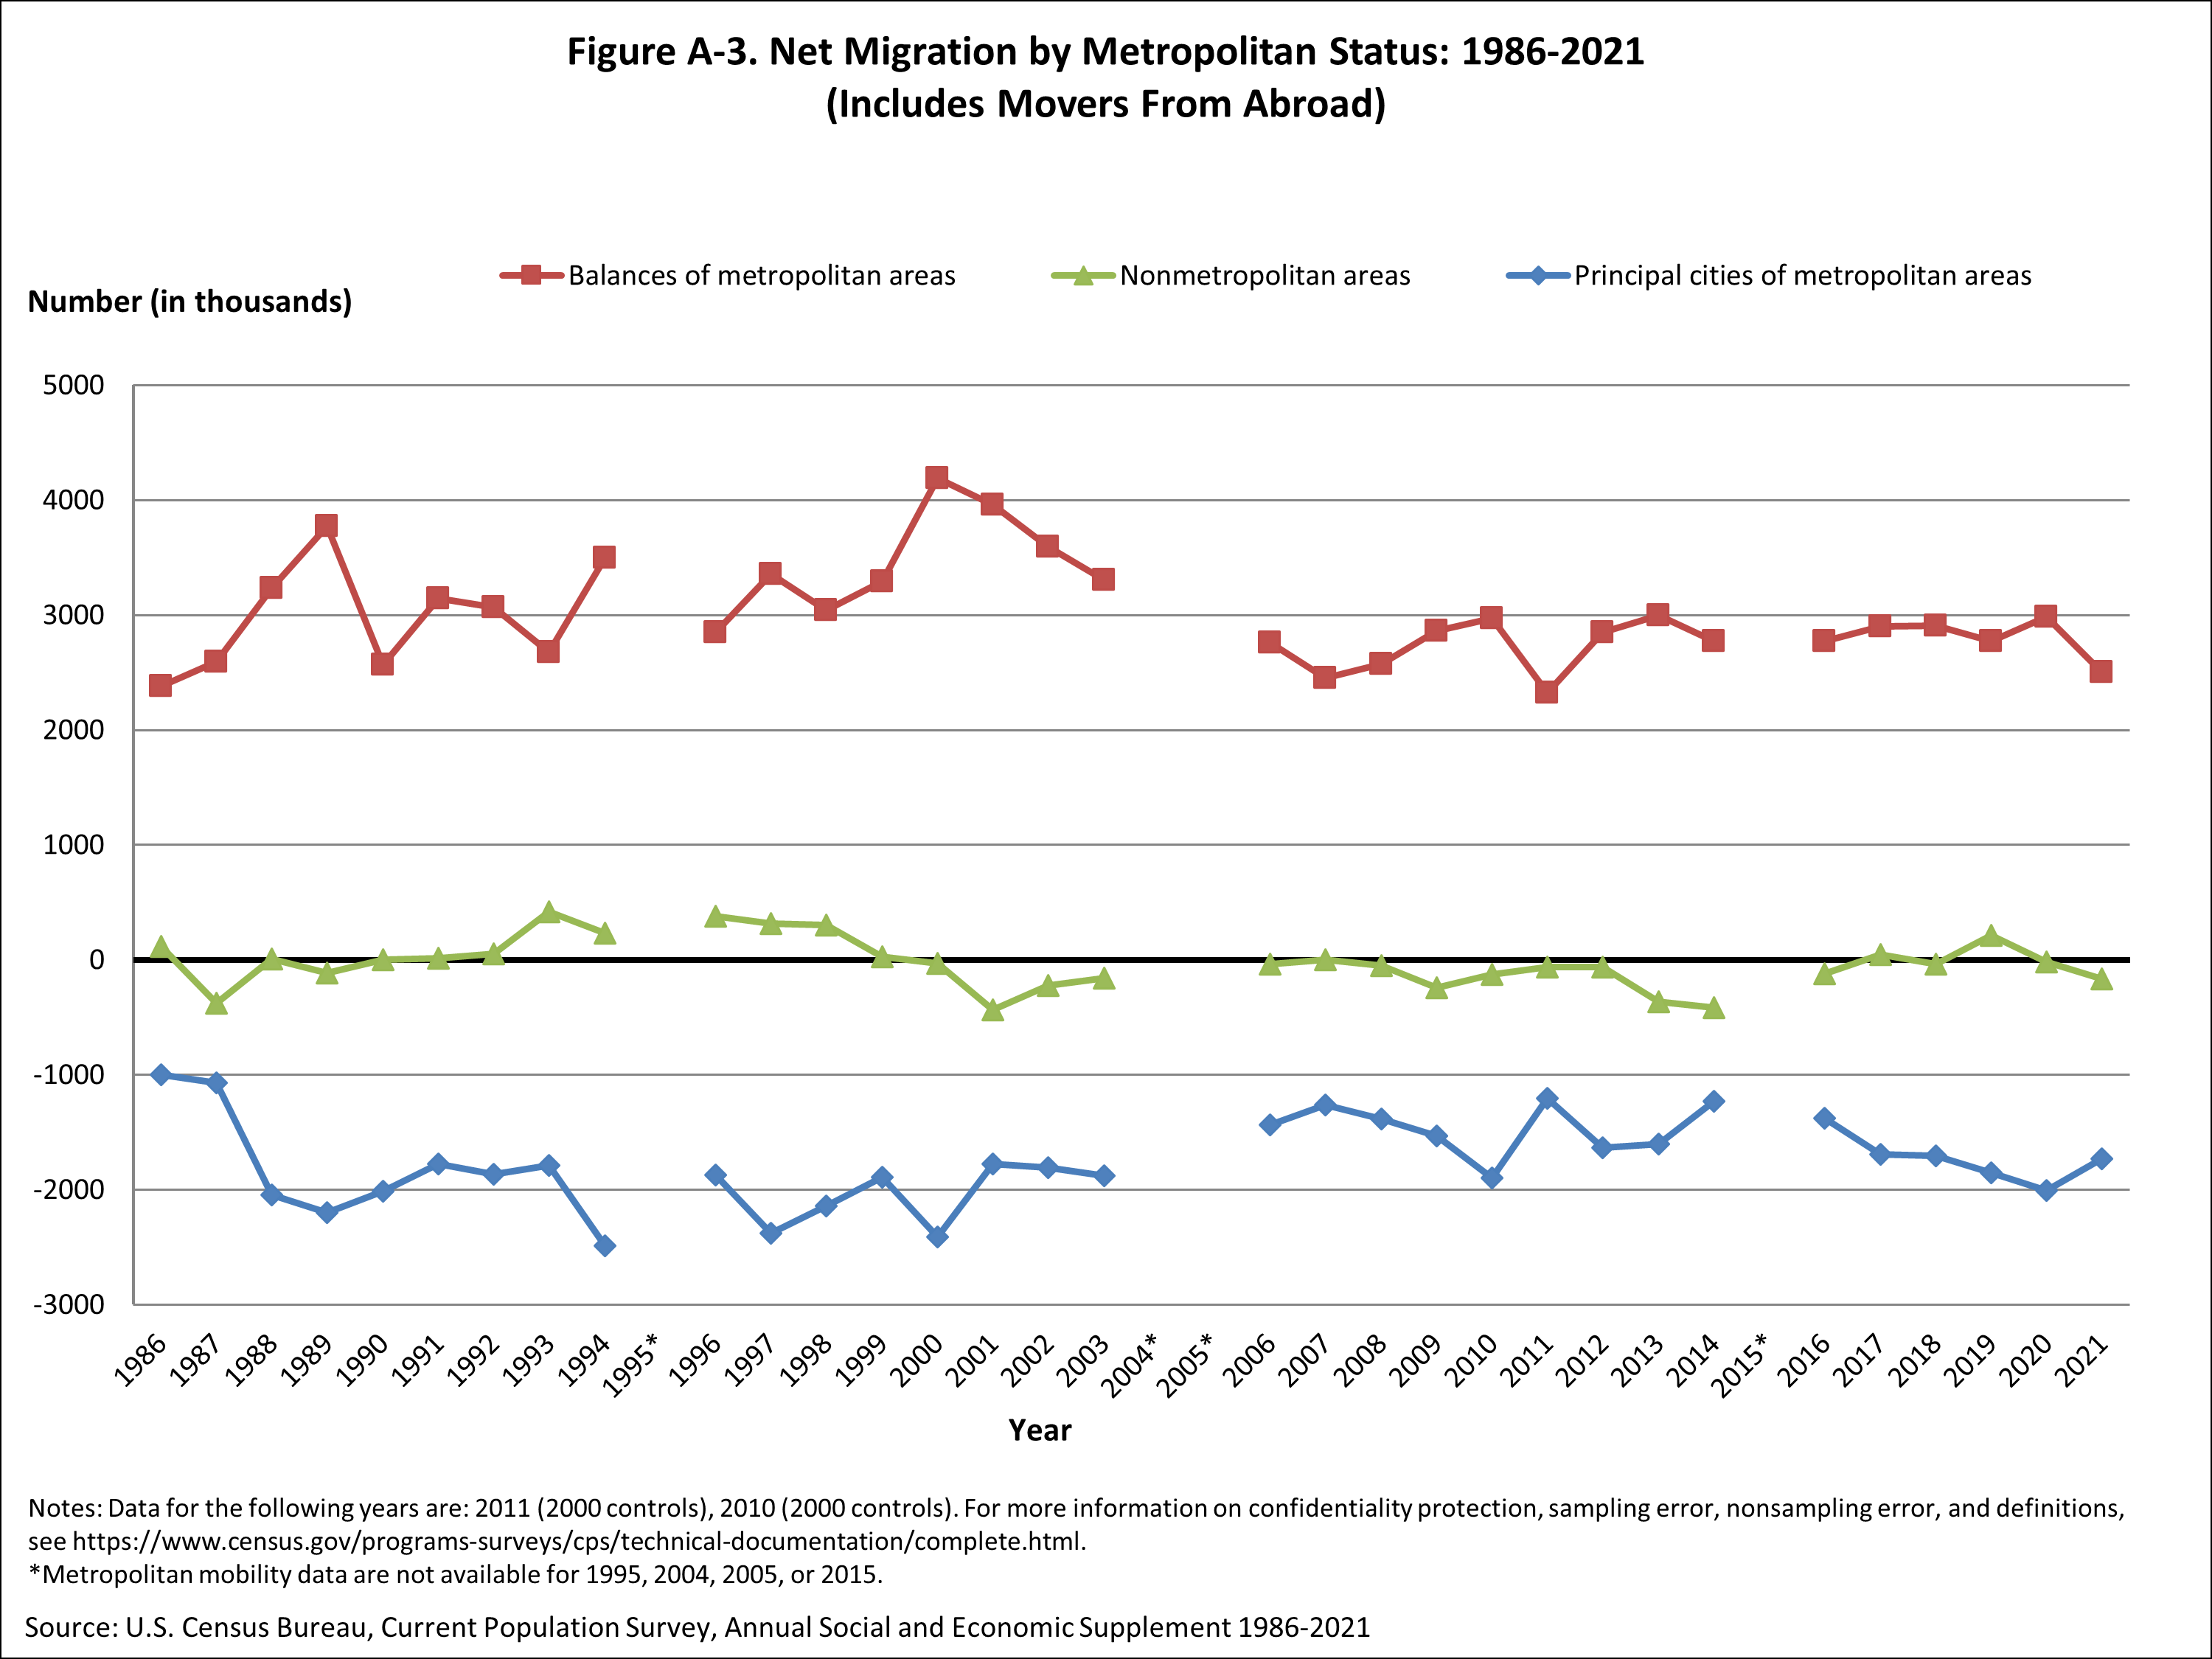
Net Migration by Metropolitan Status: 1986-2021
Line chart showing net migration in nonmetropolitan areas compared to principal cities and other metro areas from 1986 through 2021.
Date: 01/2022
Sponsoring organization: U.S. Census Bureau
view details
Line chart showing net migration in nonmetropolitan areas compared to principal cities and other metro areas from 1986 through 2021.
Date: 01/2022
Sponsoring organization: U.S. Census Bureau
view details