RHIhub Maps on Rural Demographics
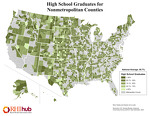
High School Graduates for Nonmetropolitan Counties
Printable map that shows the percent of population attaining at least a high school graduate education or equivalent by county. Data source: U.S. Census Bureau, ACS 5-year estimates.
Date: 12/2024
view details
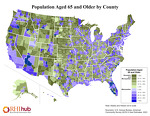
Population Aged 65 and Older by County
Printable map that shows the percent of population who are 65 years or older nationwide by county. Data source: U.S. Census Bureau, American Community Survey (ACS) 5-Year Estimates
Date: 12/2024
view details
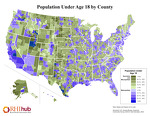
Population Under Age 18 by County
Printable map that shows the percent of population in the U.S. by county who are under 18 years of age. Data source: U.S. Census Bureau, American Community Survey (ACS) 5-Year Estimates
Date: 12/2024
view details
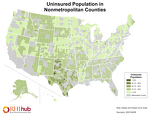
Uninsured Population in Nonmetropolitan Counties
Printable map that shows percent of population without health insurance nationwide by county. Data source: U.S. Census Bureau, Small Area Health Insurance Estimates (SAHIE)
Date: 2025
view details
Frontier
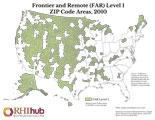
Frontier and Remote (FAR) Level 1 Zip Code Areas, 2010
Printable map that identifies the frontier and remote (FAR) level one ZIP code areas in the United States. Data source: USDA Economic Research Service, 2015.
Date: 2015
view details
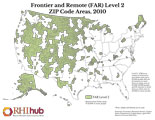
Frontier and Remote (FAR) Level 2 Zip Code Areas, 2010
Printable map that identifies the frontier and remote (FAR) level two ZIP code areas in the United States. Data source: USDA Economic Research Service
Date: 2015
view details
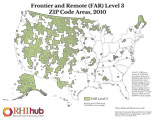
Frontier and Remote (FAR) Level 3 Zip Code Areas, 2010
Printable map that identifies the frontier and remote (FAR) level three ZIP code areas in the United States. Data source: USDA Economic Research Service, 2015.
Date: 2015
view details
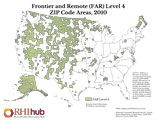
Frontier and Remote (FAR) Level 4 Zip Code Areas, 2010
Printable map that identifies the frontier and remote (FAR) level four ZIP code areas in the United States. Data source: USDA Economic Research Service, 2015.
Date: 2015
view details
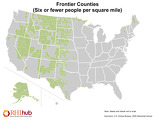
Printable map that shows the location of frontier counties nationwide. Data source: U.S. Census Bureau
Date: 2020
view details
Poverty and Income Levels
Median Household Income by County
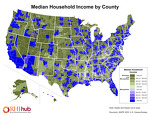
Printable map that shows the estimated median household income nationwide by county. Data source: U.S. Census Bureau, Small Area Income & Poverty Estimates
Date: 2024
view details
Population in Poverty by County
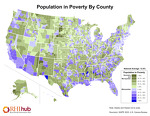
Printable map that shows poverty status of all ages nationwide by county. Data source: U.S. Census Bureau, Small Area Income & Poverty Estimates
Date: 2024
view details
Population Under Age 18 in Poverty by County
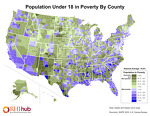
Printable map that shows poverty status of those under age 18 nationwide by county. Data source: U.S. Census Bureau, Small Area Income & Poverty Estimates
Date: 2024
view details
Racial and Ethnic Groups
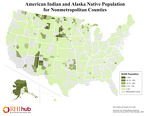
American Indian and Alaska Native Population for Nonmetropolitan Counties
Printable map that shows the percent of the U.S. population by county who are American Indian or Alaska Native. Data source: U.S. Census Bureau, American Community Survey (ACS) 5-Year Estimates
Date: 12/2024
view details
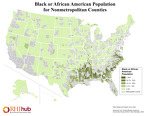
Black or African American Population for Nonmetropolitan Counties
Printable map that shows the percent of the U.S. population
by county who are Black or African American. Data source: U.S. Census Bureau, American Community Survey (ACS) 5-Year Estimates
Date: 12/2024
view details
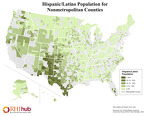
Hispanic/Latino Populations for Nonmetropolitan Counties
Printable map that shows the percent of the U.S. population by county who are Hispanic or Latino. Data source: U.S. Census Bureau, American Community Survey (ACS) 5-Year Estimates
Date: 12/2024
view details

