Rural Health
Resources by Type: Map/Mapping System
2018 Vermont Psychiatrists by Mental Health Catchment Area: Population per FTE
County level map of psychiatrists by service area for the state of Vermont.
Date: 01/2020
Sponsoring organization: Vermont Department of Health
view details
County level map of psychiatrists by service area for the state of Vermont.
Date: 01/2020
Sponsoring organization: Vermont Department of Health
view details
Oklahoma: 2020 Core Based Statistical Areas and Counties
Map identifying the metropolitan, micropolitan, and non-Core Based Statistical Areas (CBSA) in Oklahoma using 2020 Census data.
Date: 2020
Sponsoring organization: U.S. Census Bureau
view details
Map identifying the metropolitan, micropolitan, and non-Core Based Statistical Areas (CBSA) in Oklahoma using 2020 Census data.
Date: 2020
Sponsoring organization: U.S. Census Bureau
view details
Nebraska Counties with Population under 15,000
State map of Nebraska showing counties that have populations under 15,000 residents.
Date: 2020
Sponsoring organization: Nebraska Department of Health and Human Services
view details
State map of Nebraska showing counties that have populations under 15,000 residents.
Date: 2020
Sponsoring organization: Nebraska Department of Health and Human Services
view details
2020 Census Tribal Tract Reference Maps
Lists federal American Indian reservation maps showing tribal census tracts and tribal block groups. Maps show the boundaries and names of American Indian reservations and off-reservation trust lands, Alaska Native areas, Hawaiian home lands, states, counties, county subdivisions and places.
Date: 2020
Sponsoring organization: U.S. Census Bureau
view details
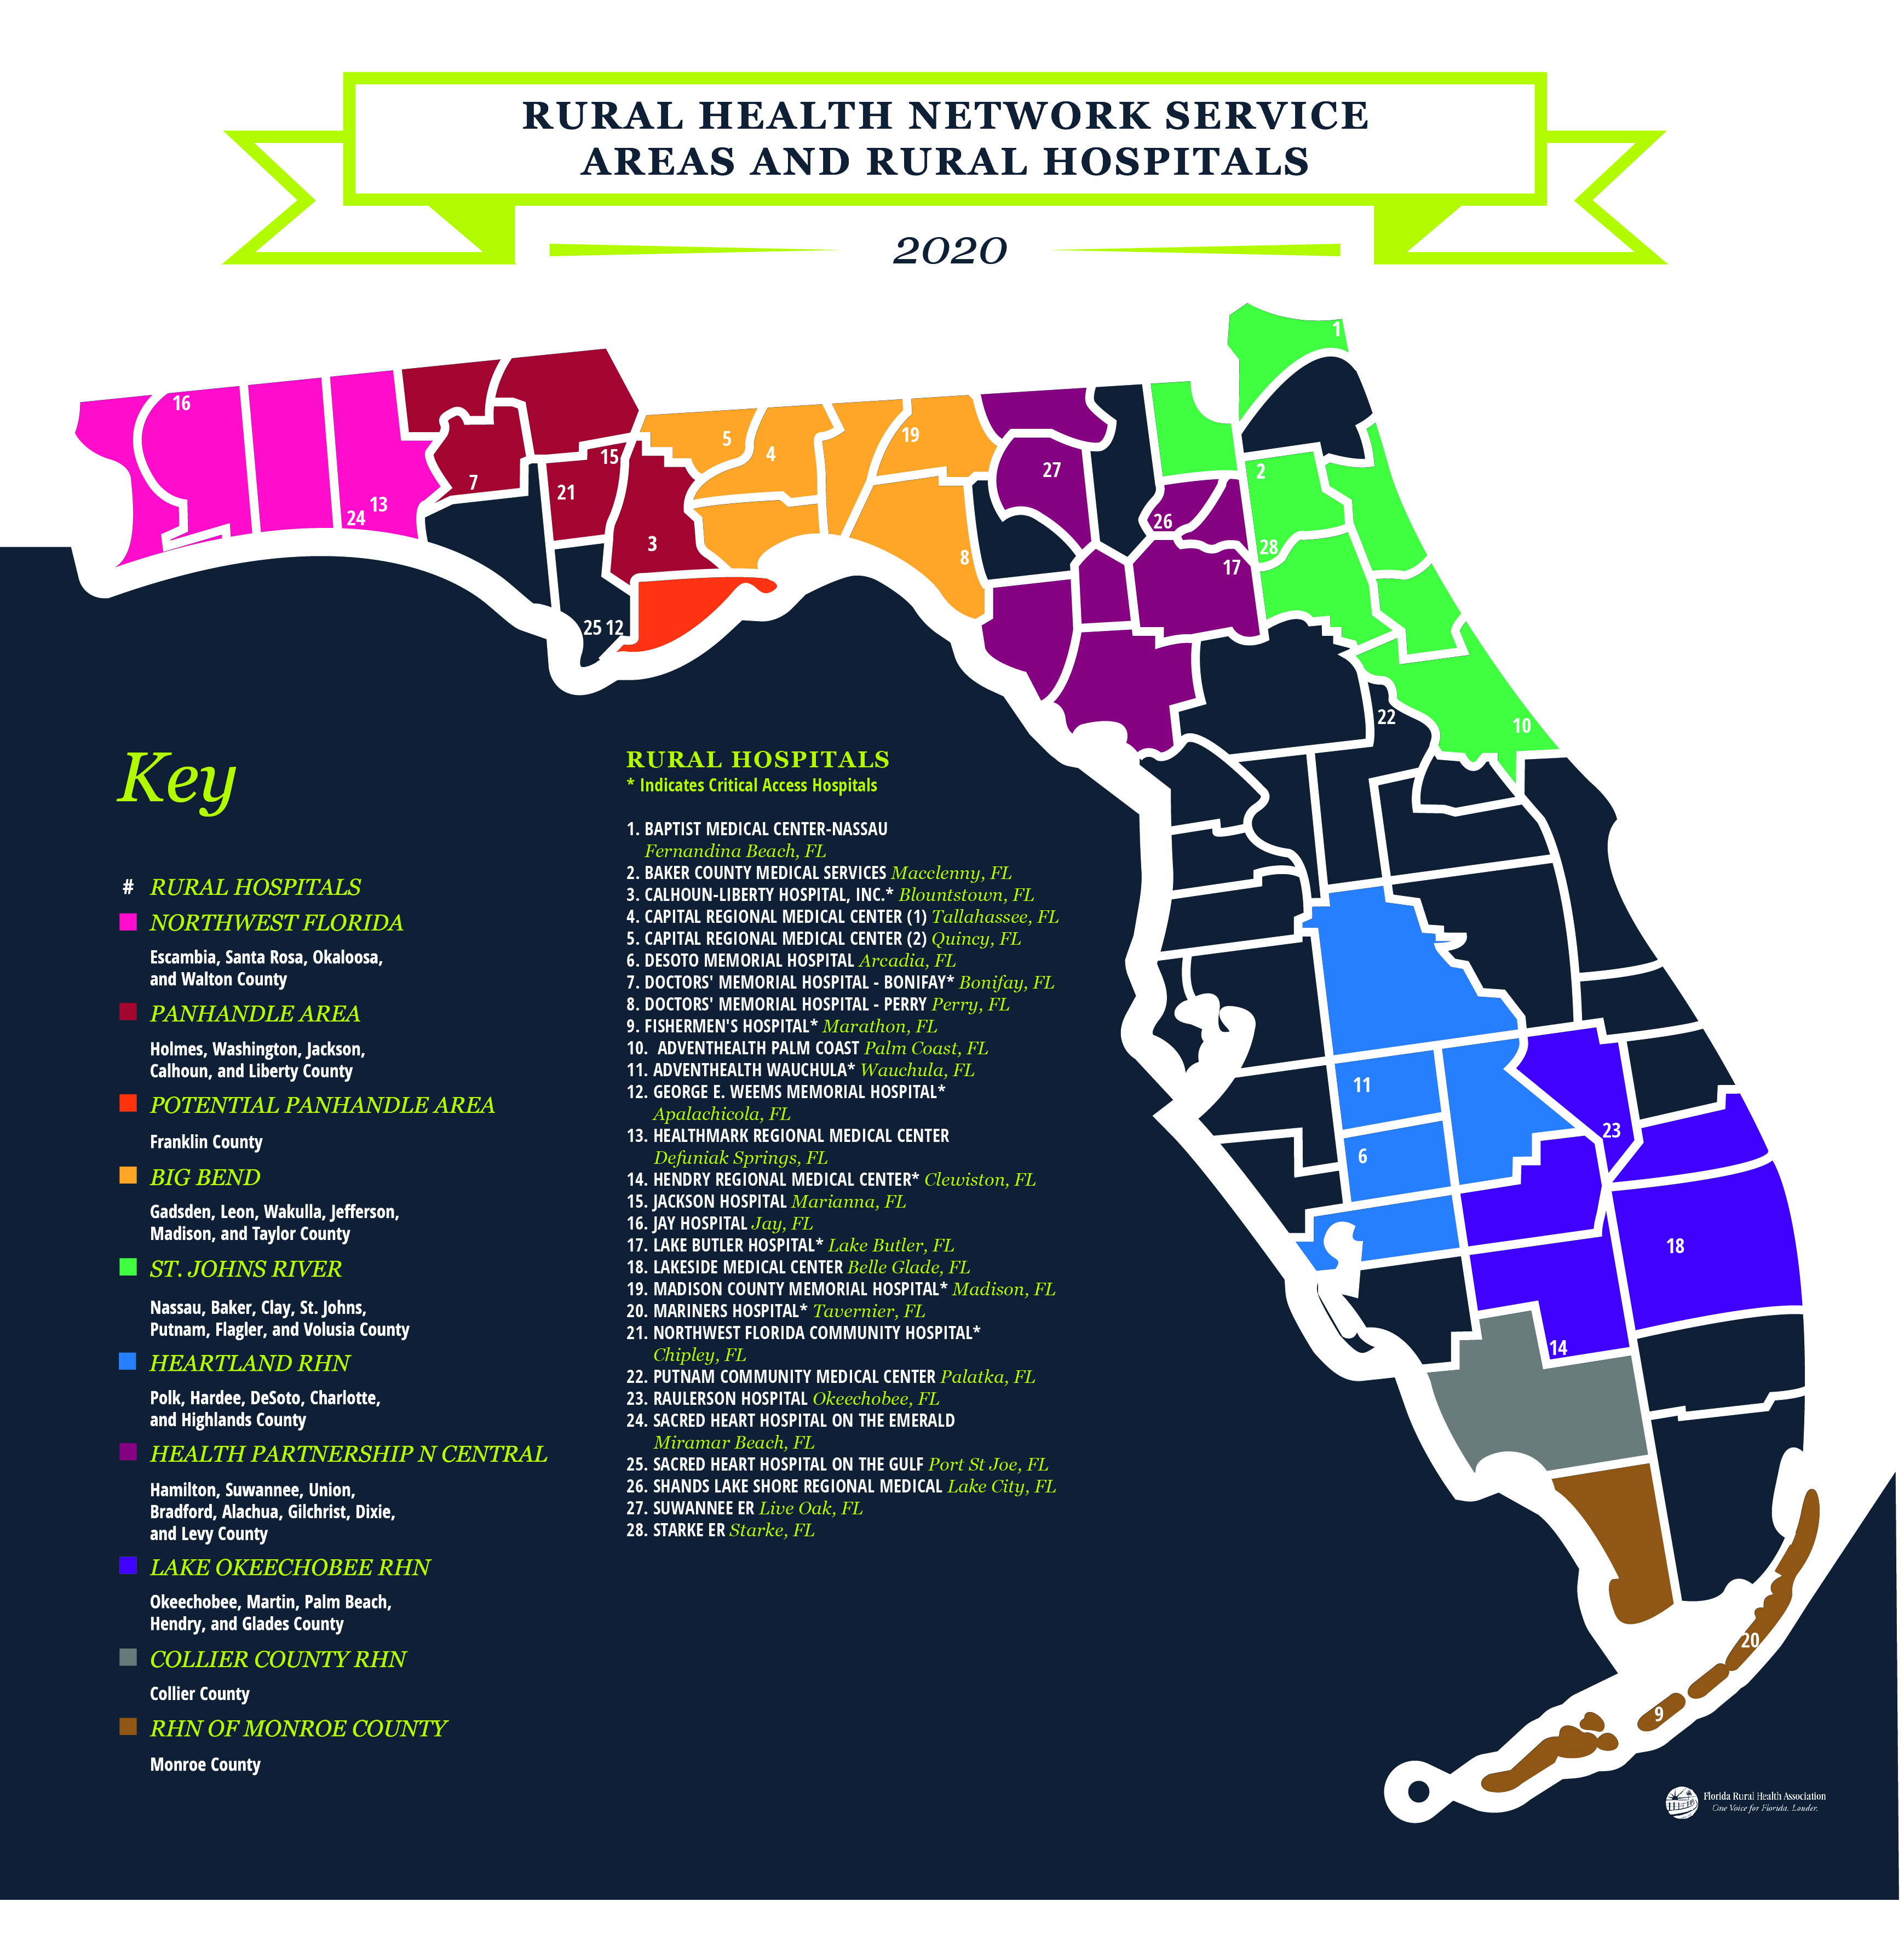
Florida Rural Health Network Service Areas and Rural Hospitals 2020
Map of Florida with counties delineated identifying the rural health network service areas and the location of rural hospitals including Critical Access Hospitals.
Date: 2020
Sponsoring organization: Florida Office of Rural Health
view details
Map of Florida with counties delineated identifying the rural health network service areas and the location of rural hospitals including Critical Access Hospitals.
Date: 2020
Sponsoring organization: Florida Office of Rural Health
view details
Frontier Counties
Printable map that shows the location of frontier counties nationwide. Data source: U.S. Census Bureau
Date: 2020
Sponsoring organization: Rural Health Information Hub
view details
Printable map that shows the location of frontier counties nationwide. Data source: U.S. Census Bureau
Date: 2020
Sponsoring organization: Rural Health Information Hub
view details
Federally Qualified Healthcare Centers (FQHC) in Oklahoma
County-level map of Oklahoma identifying the communities with Federally Qualified Health Centers (FQHCs).
Date: 12/2019
Sponsoring organization: Oklahoma State University Center for Rural Health
view details
County-level map of Oklahoma identifying the communities with Federally Qualified Health Centers (FQHCs).
Date: 12/2019
Sponsoring organization: Oklahoma State University Center for Rural Health
view details
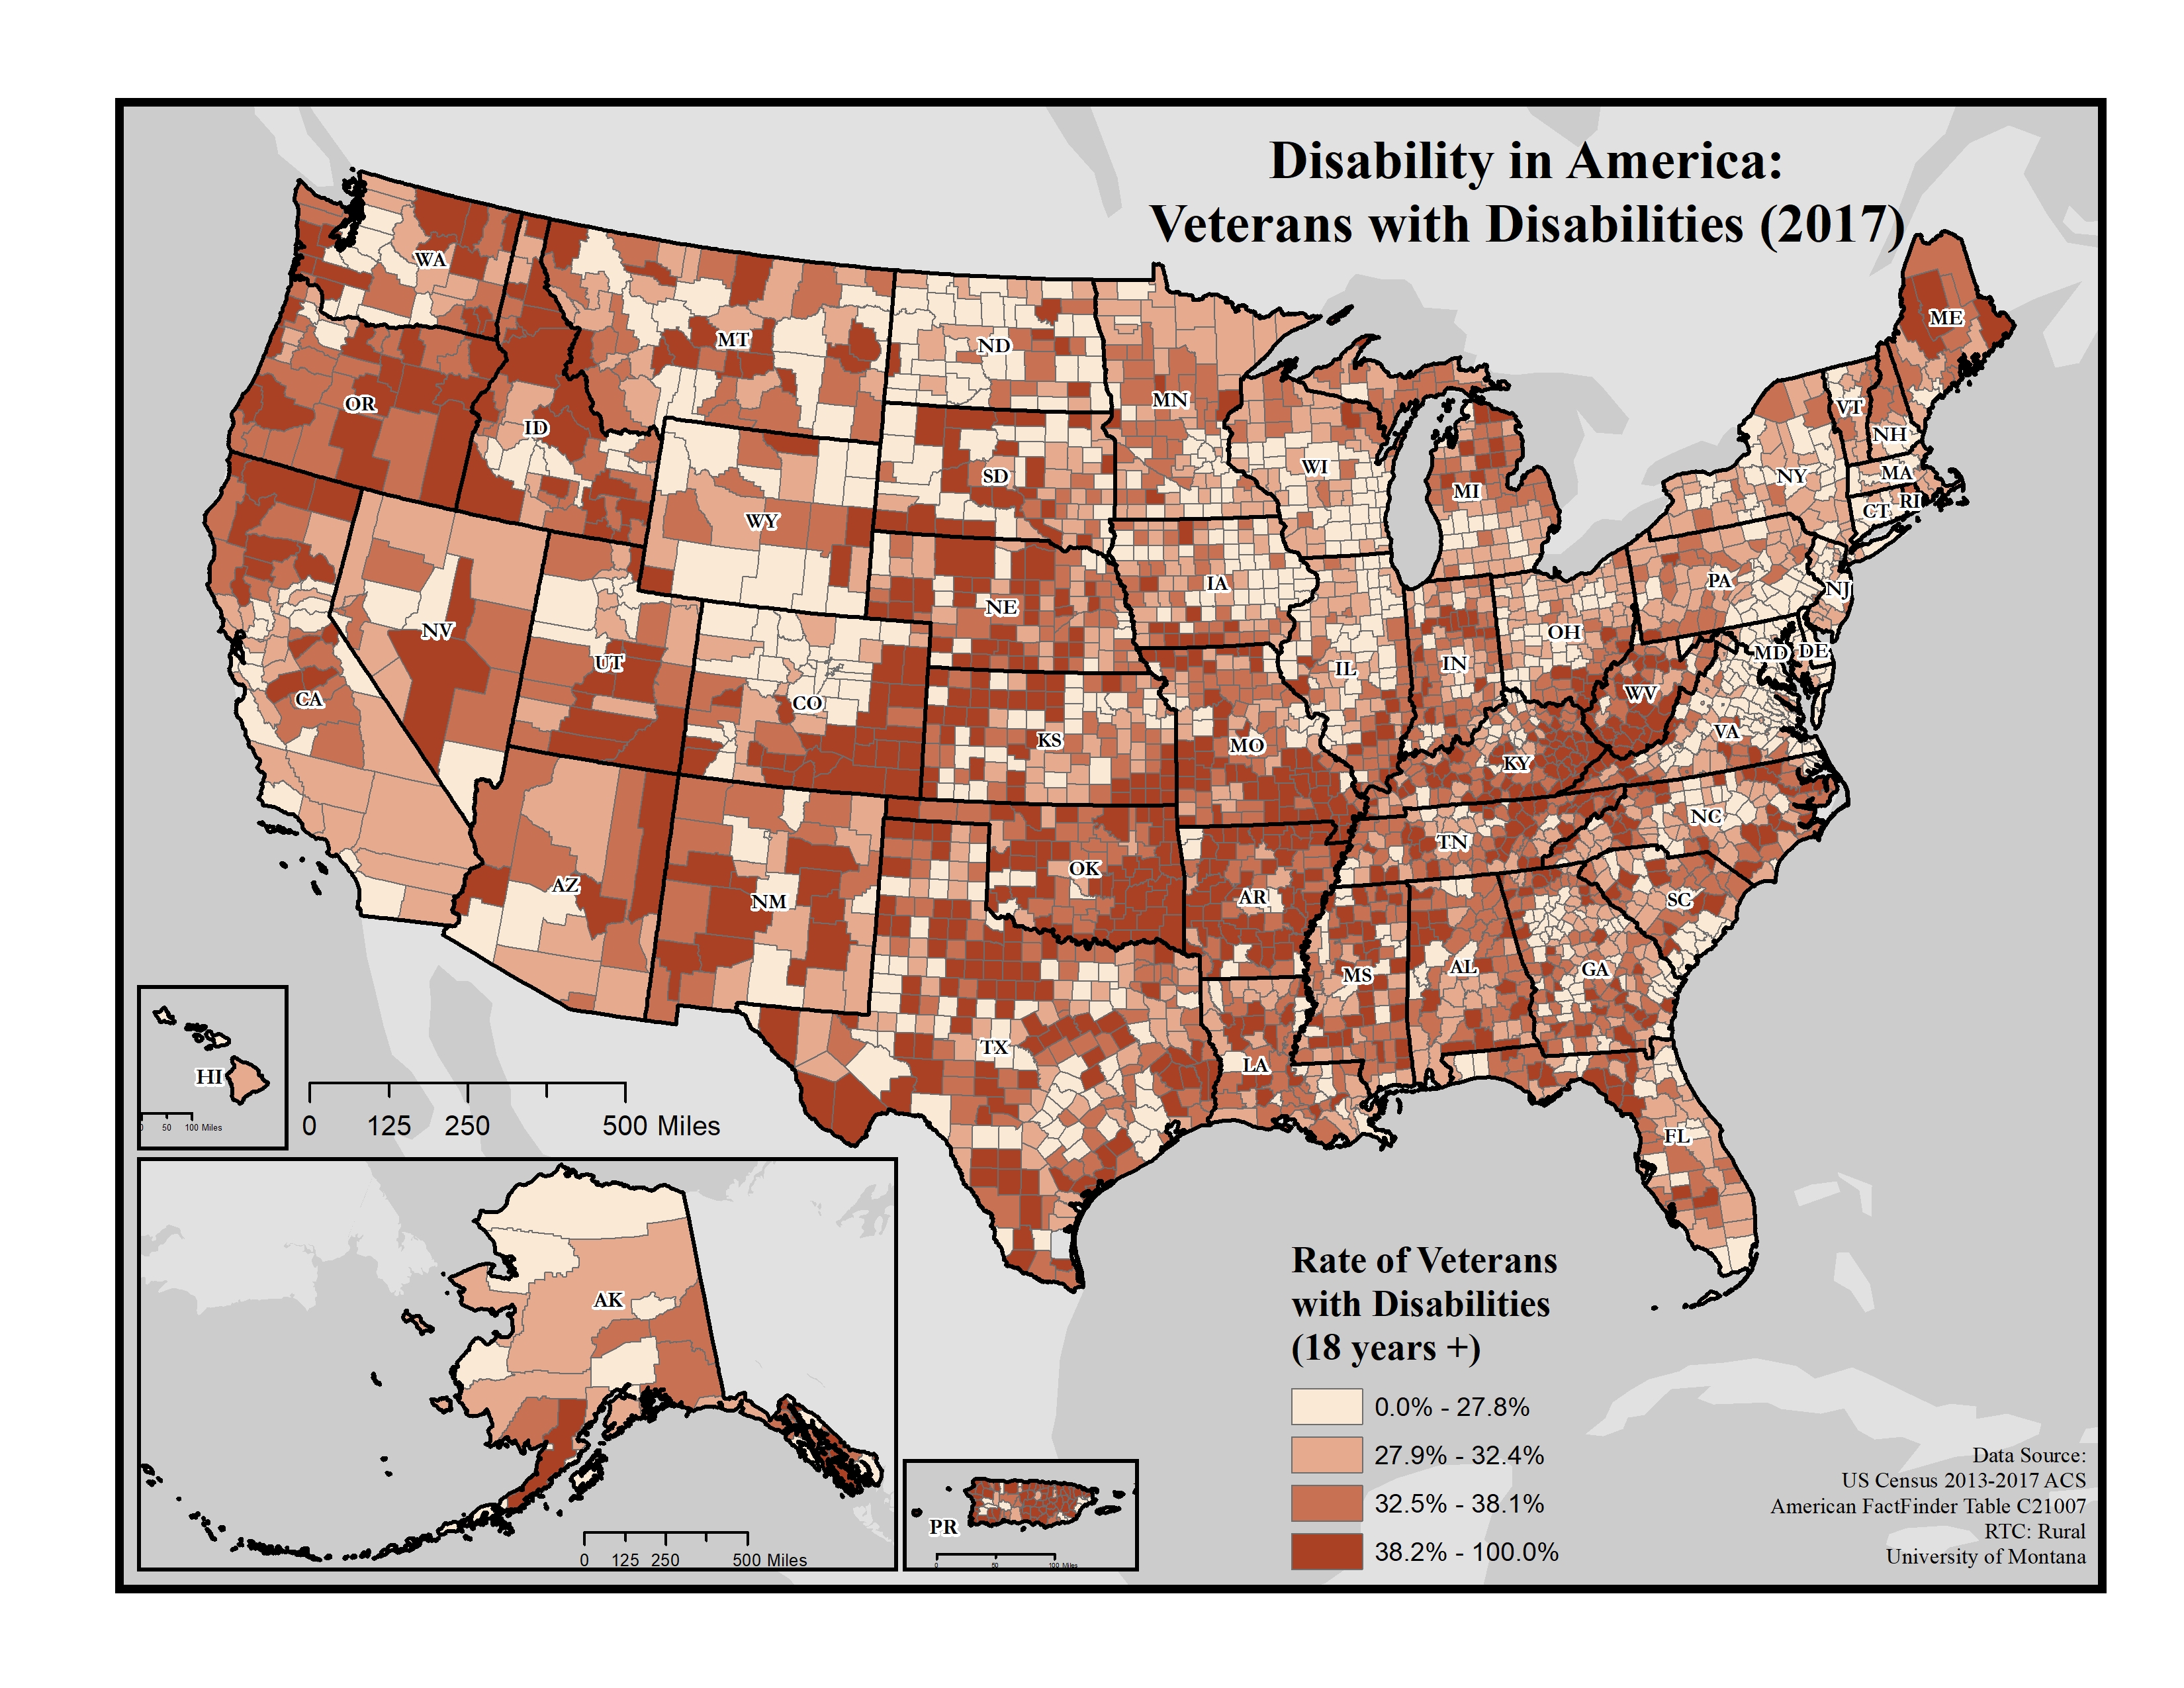
Disability in America: Veterans with Disabilities (2017)
Displays the disability rate among veterans on the county level using data from the 2013-2017 American Community Survey (ACS).
Date: 10/2019
Sponsoring organization: Research and Training Center on Disability in Rural Communities
view details
Displays the disability rate among veterans on the county level using data from the 2013-2017 American Community Survey (ACS).
Date: 10/2019
Sponsoring organization: Research and Training Center on Disability in Rural Communities
view details
Texas Rural Hospital Closures Since January 2013
A map identifying the location of rural hospital closures in Texas along with whether they later reopened or now provide limited services.
Date: 09/2019
Sponsoring organization: Texas Organization of Rural & Community Hospitals
view details
A map identifying the location of rural hospital closures in Texas along with whether they later reopened or now provide limited services.
Date: 09/2019
Sponsoring organization: Texas Organization of Rural & Community Hospitals
view details
Texas Map of Rural Hospitals
Map identifying the location of rural hospitals in Texas.
Date: 09/2019
Sponsoring organization: Texas Organization of Rural & Community Hospitals
view details
Map identifying the location of rural hospitals in Texas.
Date: 09/2019
Sponsoring organization: Texas Organization of Rural & Community Hospitals
view details