Rural Health
Resources by Topic: County-by-county data
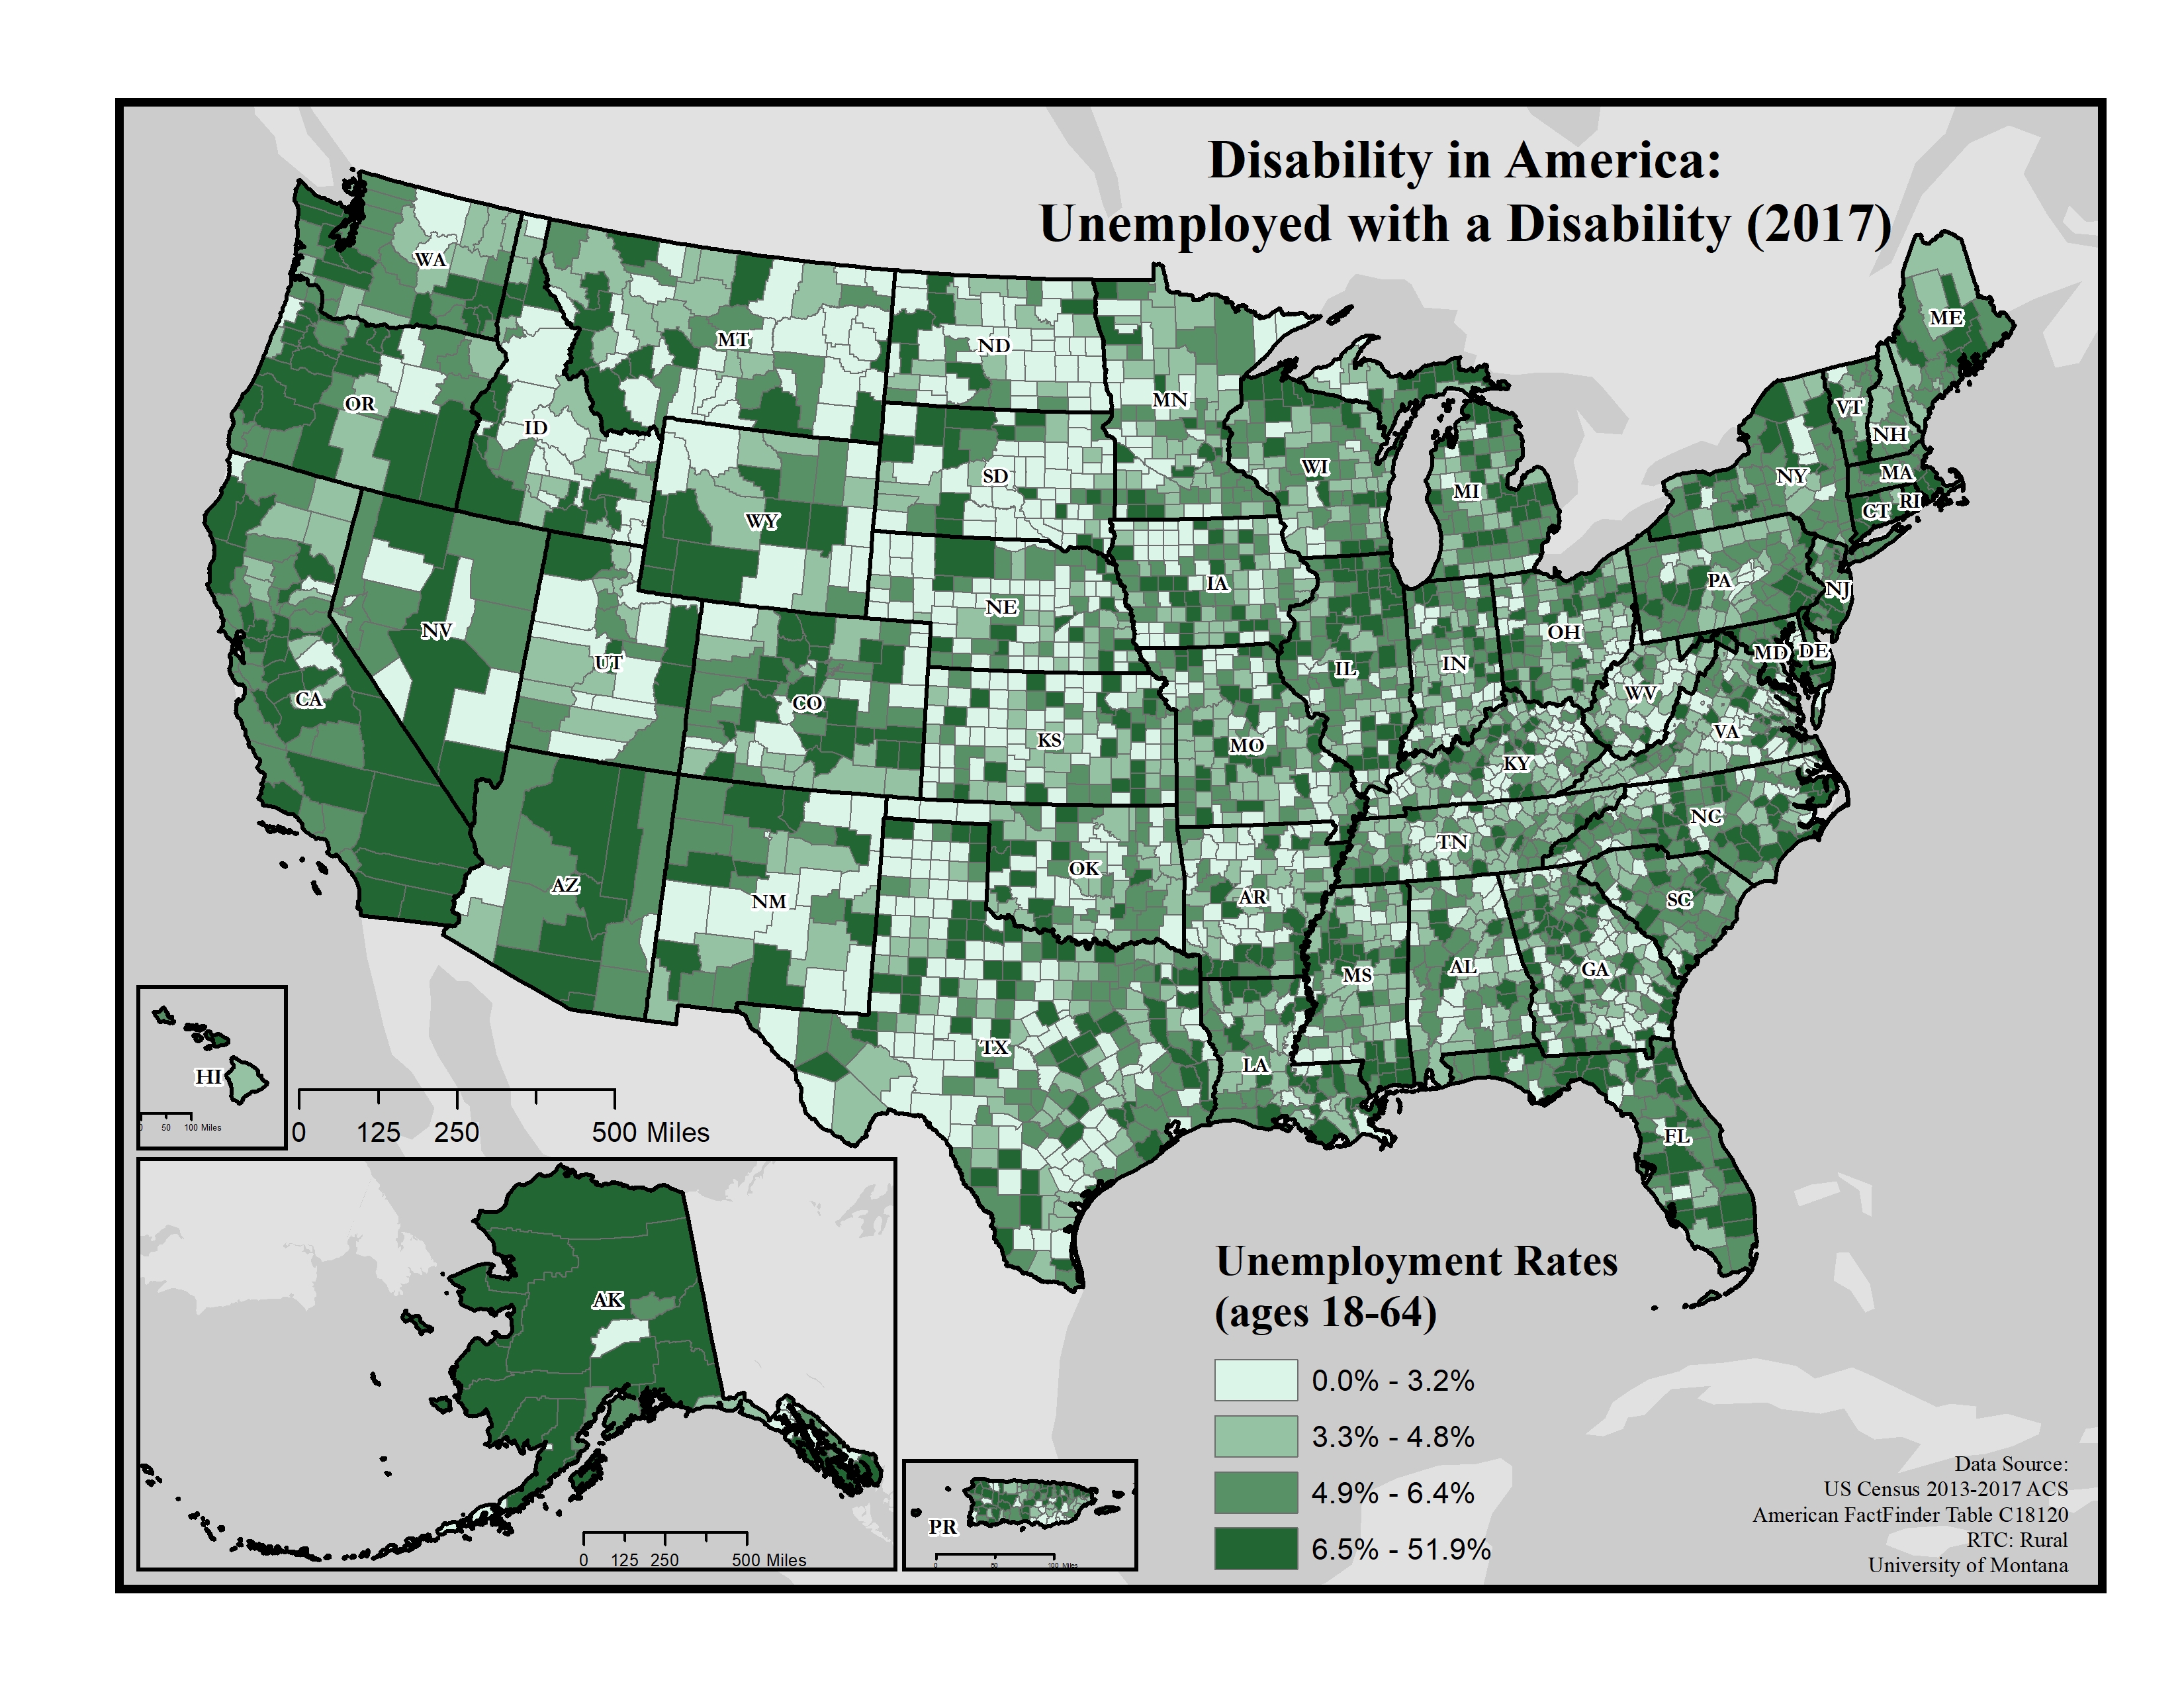
Disability in America: Unemployed with a Disability (2017)
Displays the unemployment rates among adults 18 to 64 years old with a disability on the county level using data from the 2013-2017 American Community Survey (ACS).
Date: 01/2019
Sponsoring organization: Research and Training Center on Disability in Rural Communities
view details
Displays the unemployment rates among adults 18 to 64 years old with a disability on the county level using data from the 2013-2017 American Community Survey (ACS).
Date: 01/2019
Sponsoring organization: Research and Training Center on Disability in Rural Communities
view details
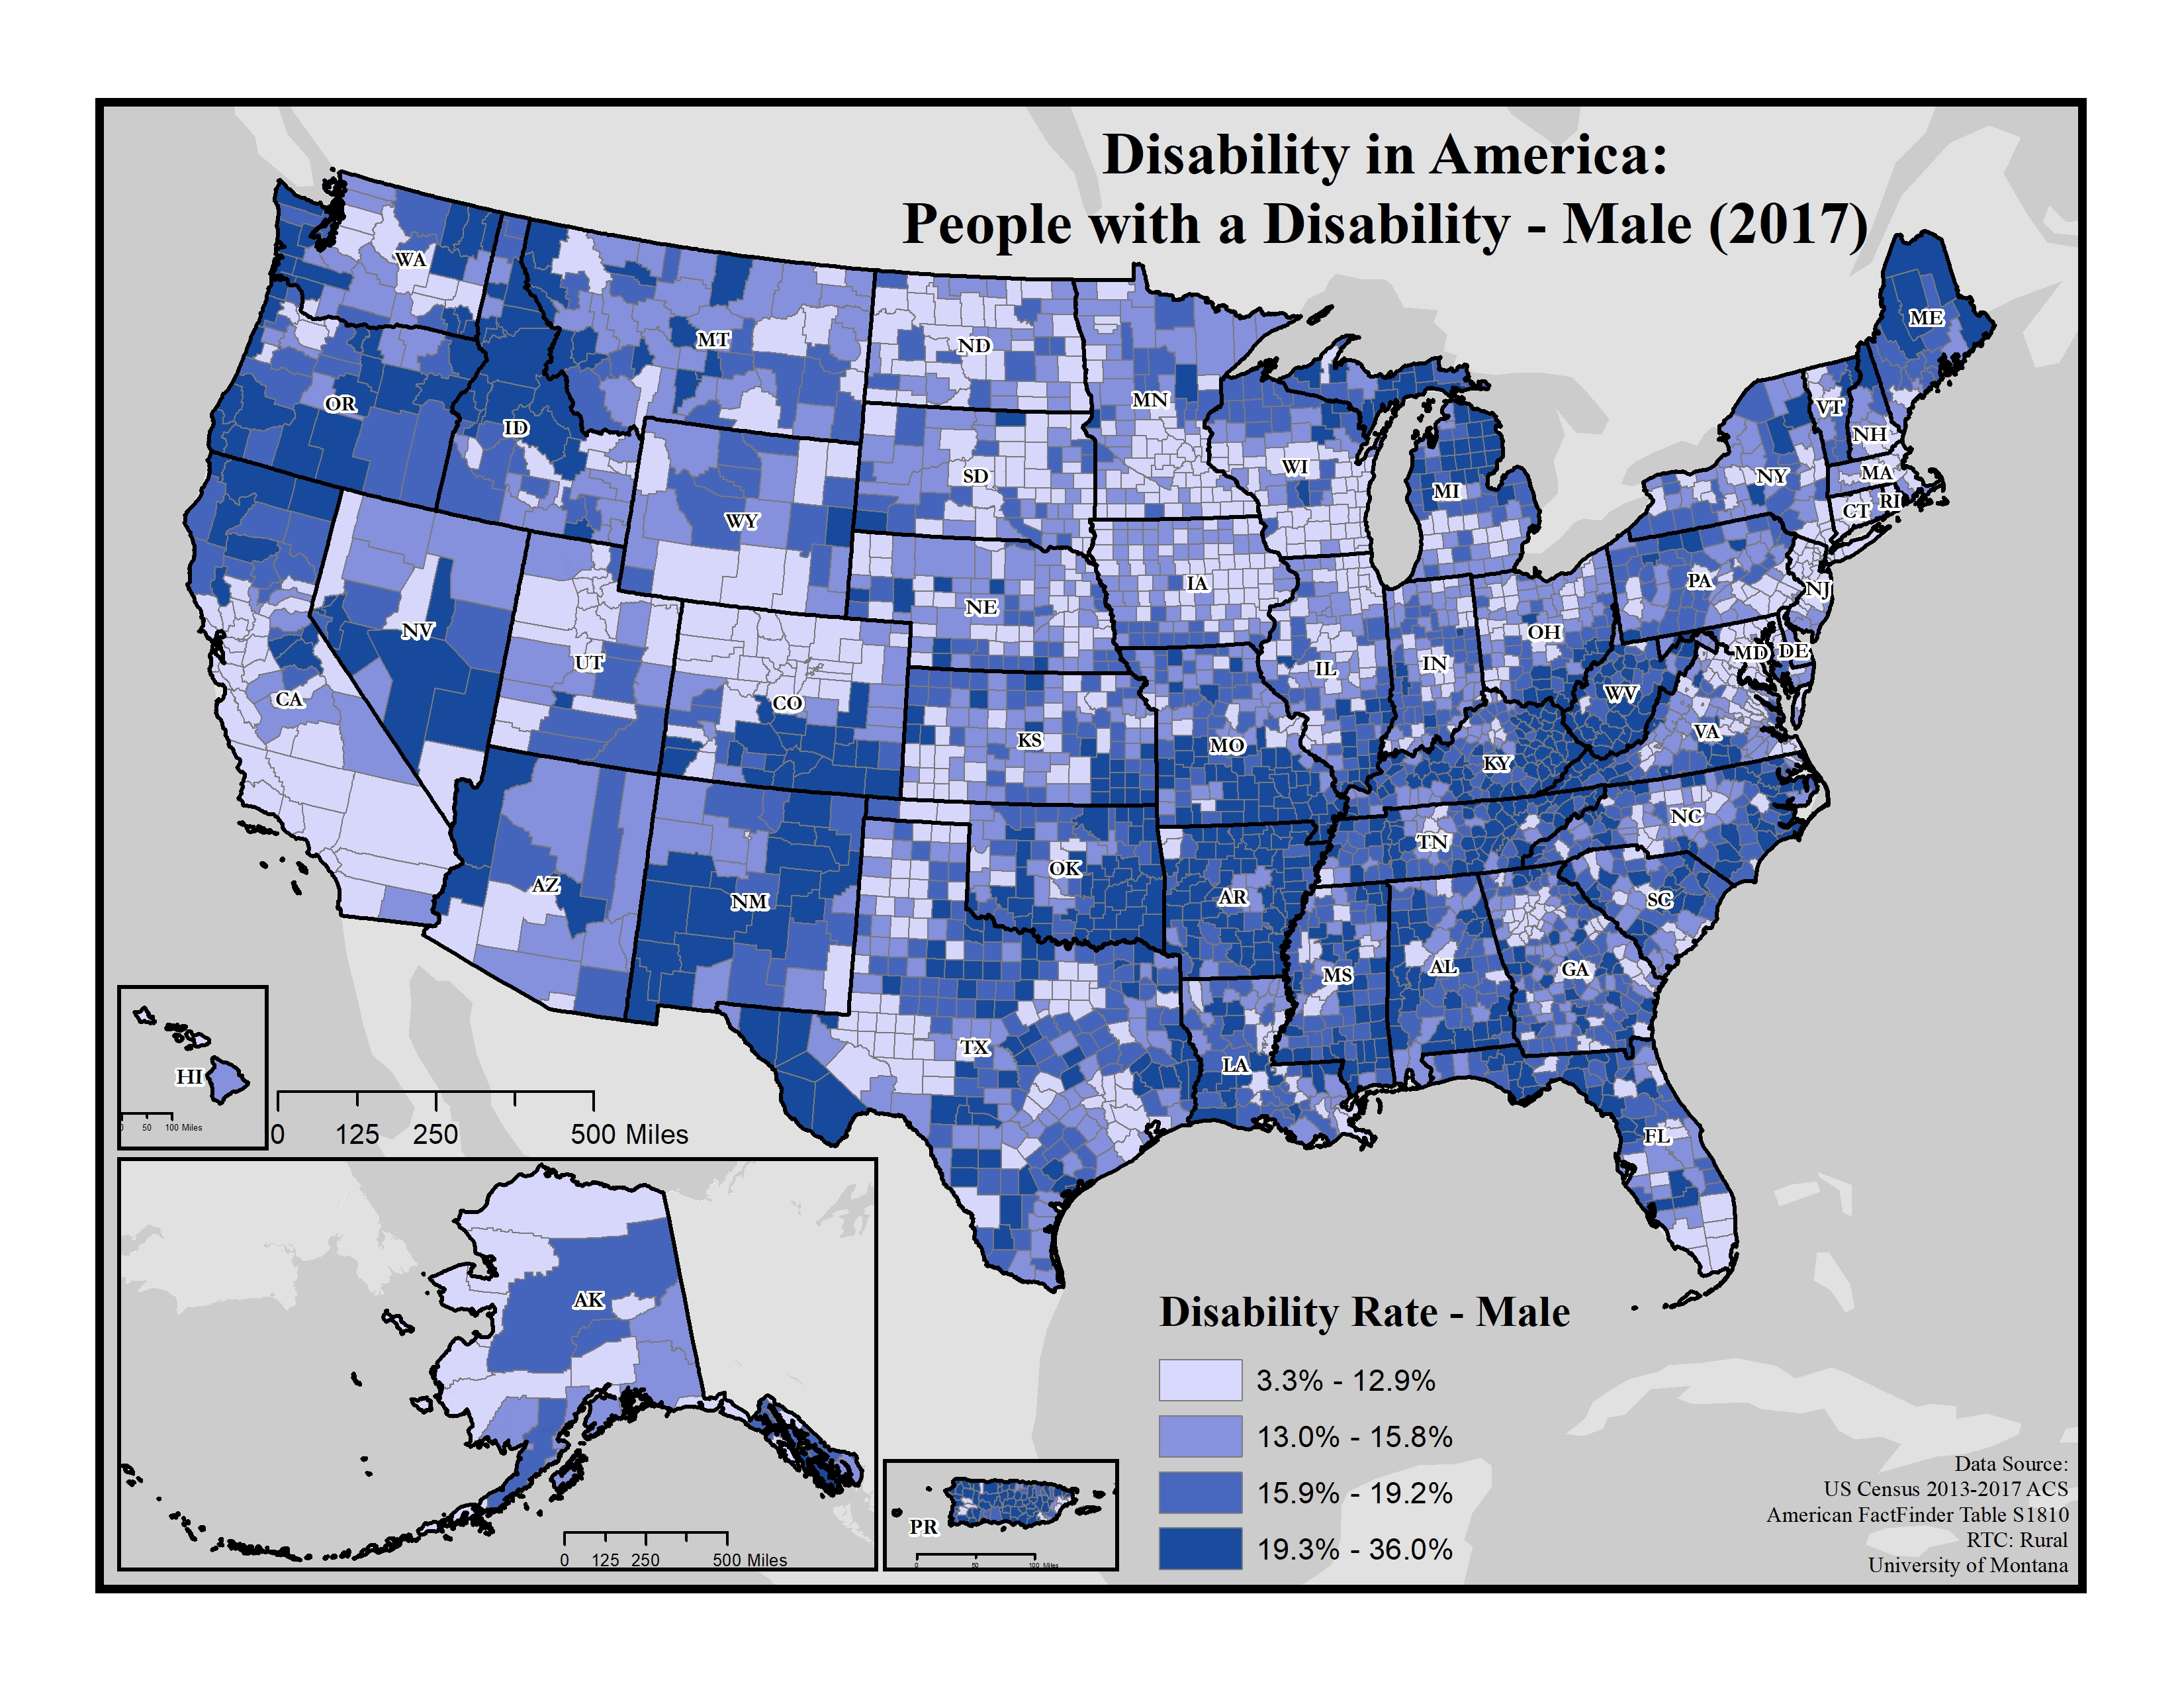
Disability in America: People with a Disability - Male (2017)
Displays disability rates among males on the county level using data from the 2013-2017 American Community Survey (ACS).
Date: 01/2019
Sponsoring organization: Research and Training Center on Disability in Rural Communities
view details
Displays disability rates among males on the county level using data from the 2013-2017 American Community Survey (ACS).
Date: 01/2019
Sponsoring organization: Research and Training Center on Disability in Rural Communities
view details
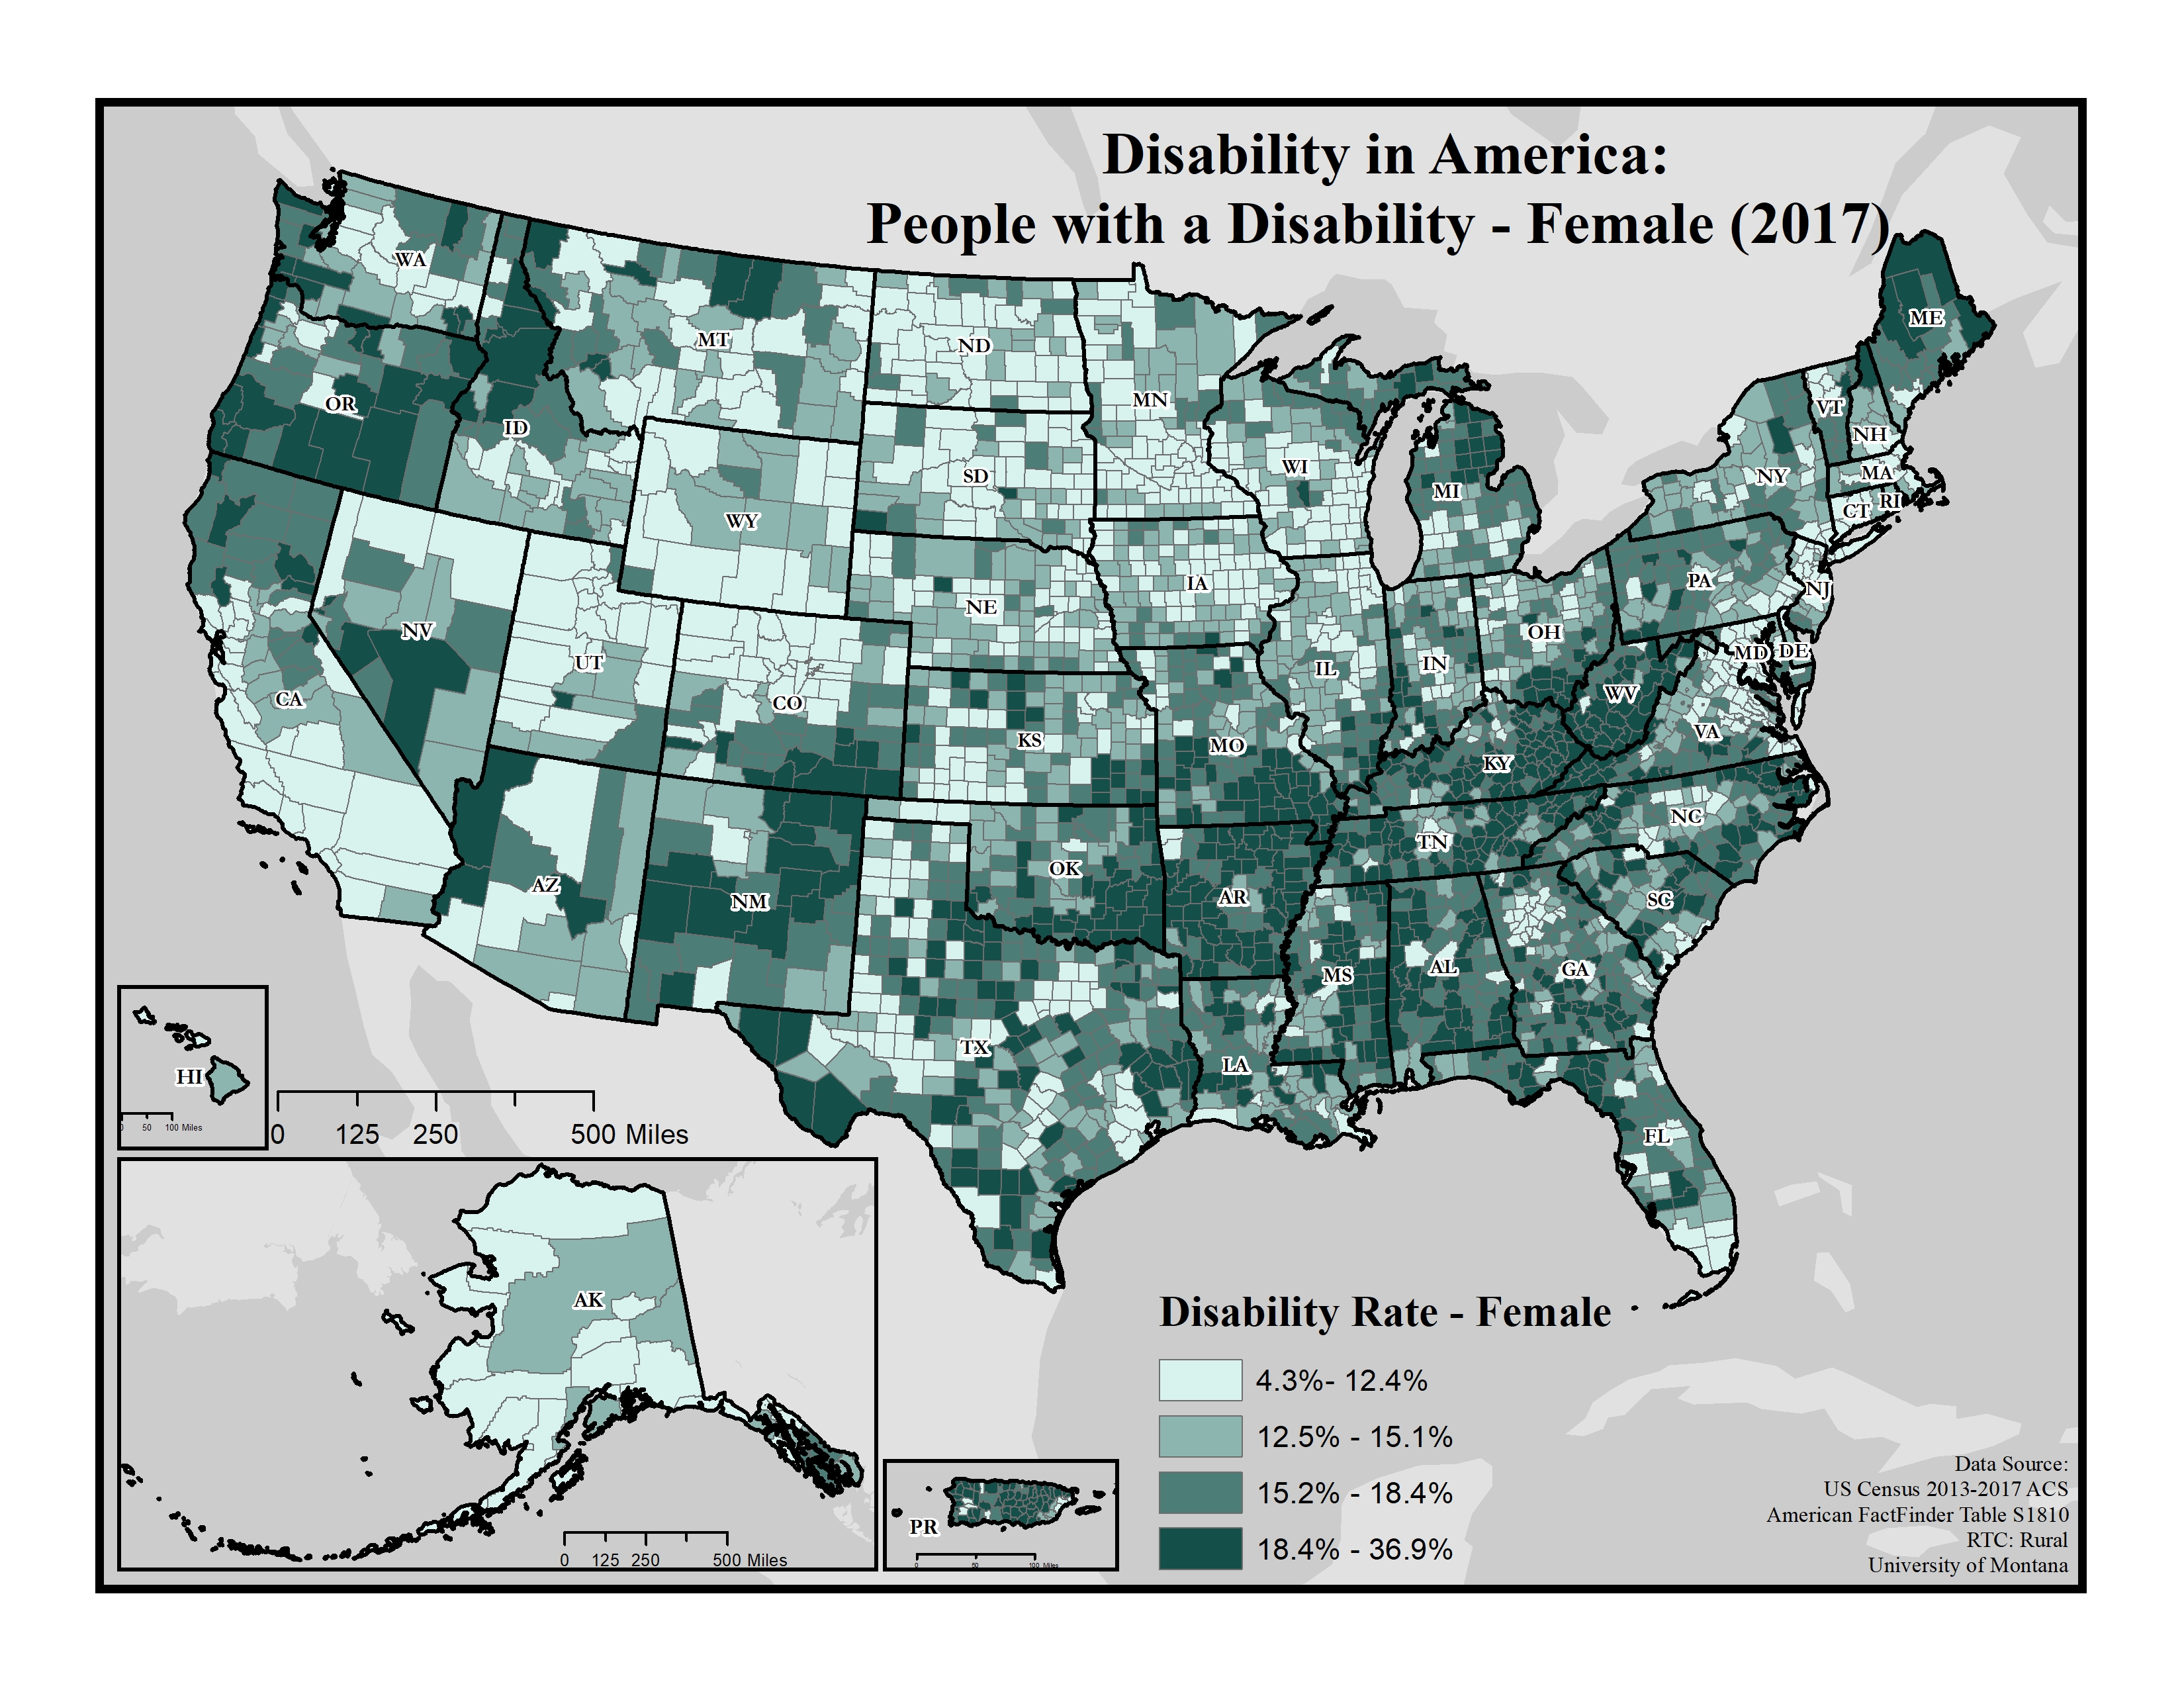
Disability in America: People with a Disability - Female (2017)
Displays disability rates among females on the county level using data from the 2013-2017 American Community Survey (ACS).
Date: 01/2019
Sponsoring organization: Research and Training Center on Disability in Rural Communities
view details
Displays disability rates among females on the county level using data from the 2013-2017 American Community Survey (ACS).
Date: 01/2019
Sponsoring organization: Research and Training Center on Disability in Rural Communities
view details
Vermont All Core Mental Health Providers by Mental Health Catchment Area: Population per FT
County level map of all core mental health providers including psychologists, social workers, marriage and family therapists, and psychiatric advanced practice registered nurses by service area for the state of Vermont.
Date: 01/2019
Sponsoring organization: Vermont Department of Health
view details
Vermont All Psychiatrists and Core Mental Health Providers by Mental Health Catchment Area: Population per FT
County level map of all psychiatrists and core mental health providers including psychologists, social workers, marriage and family therapists, and psychiatric advanced practice registered nurses by service area for the state of Vermont.
Date: 01/2019
Sponsoring organization: Vermont Department of Health
view details
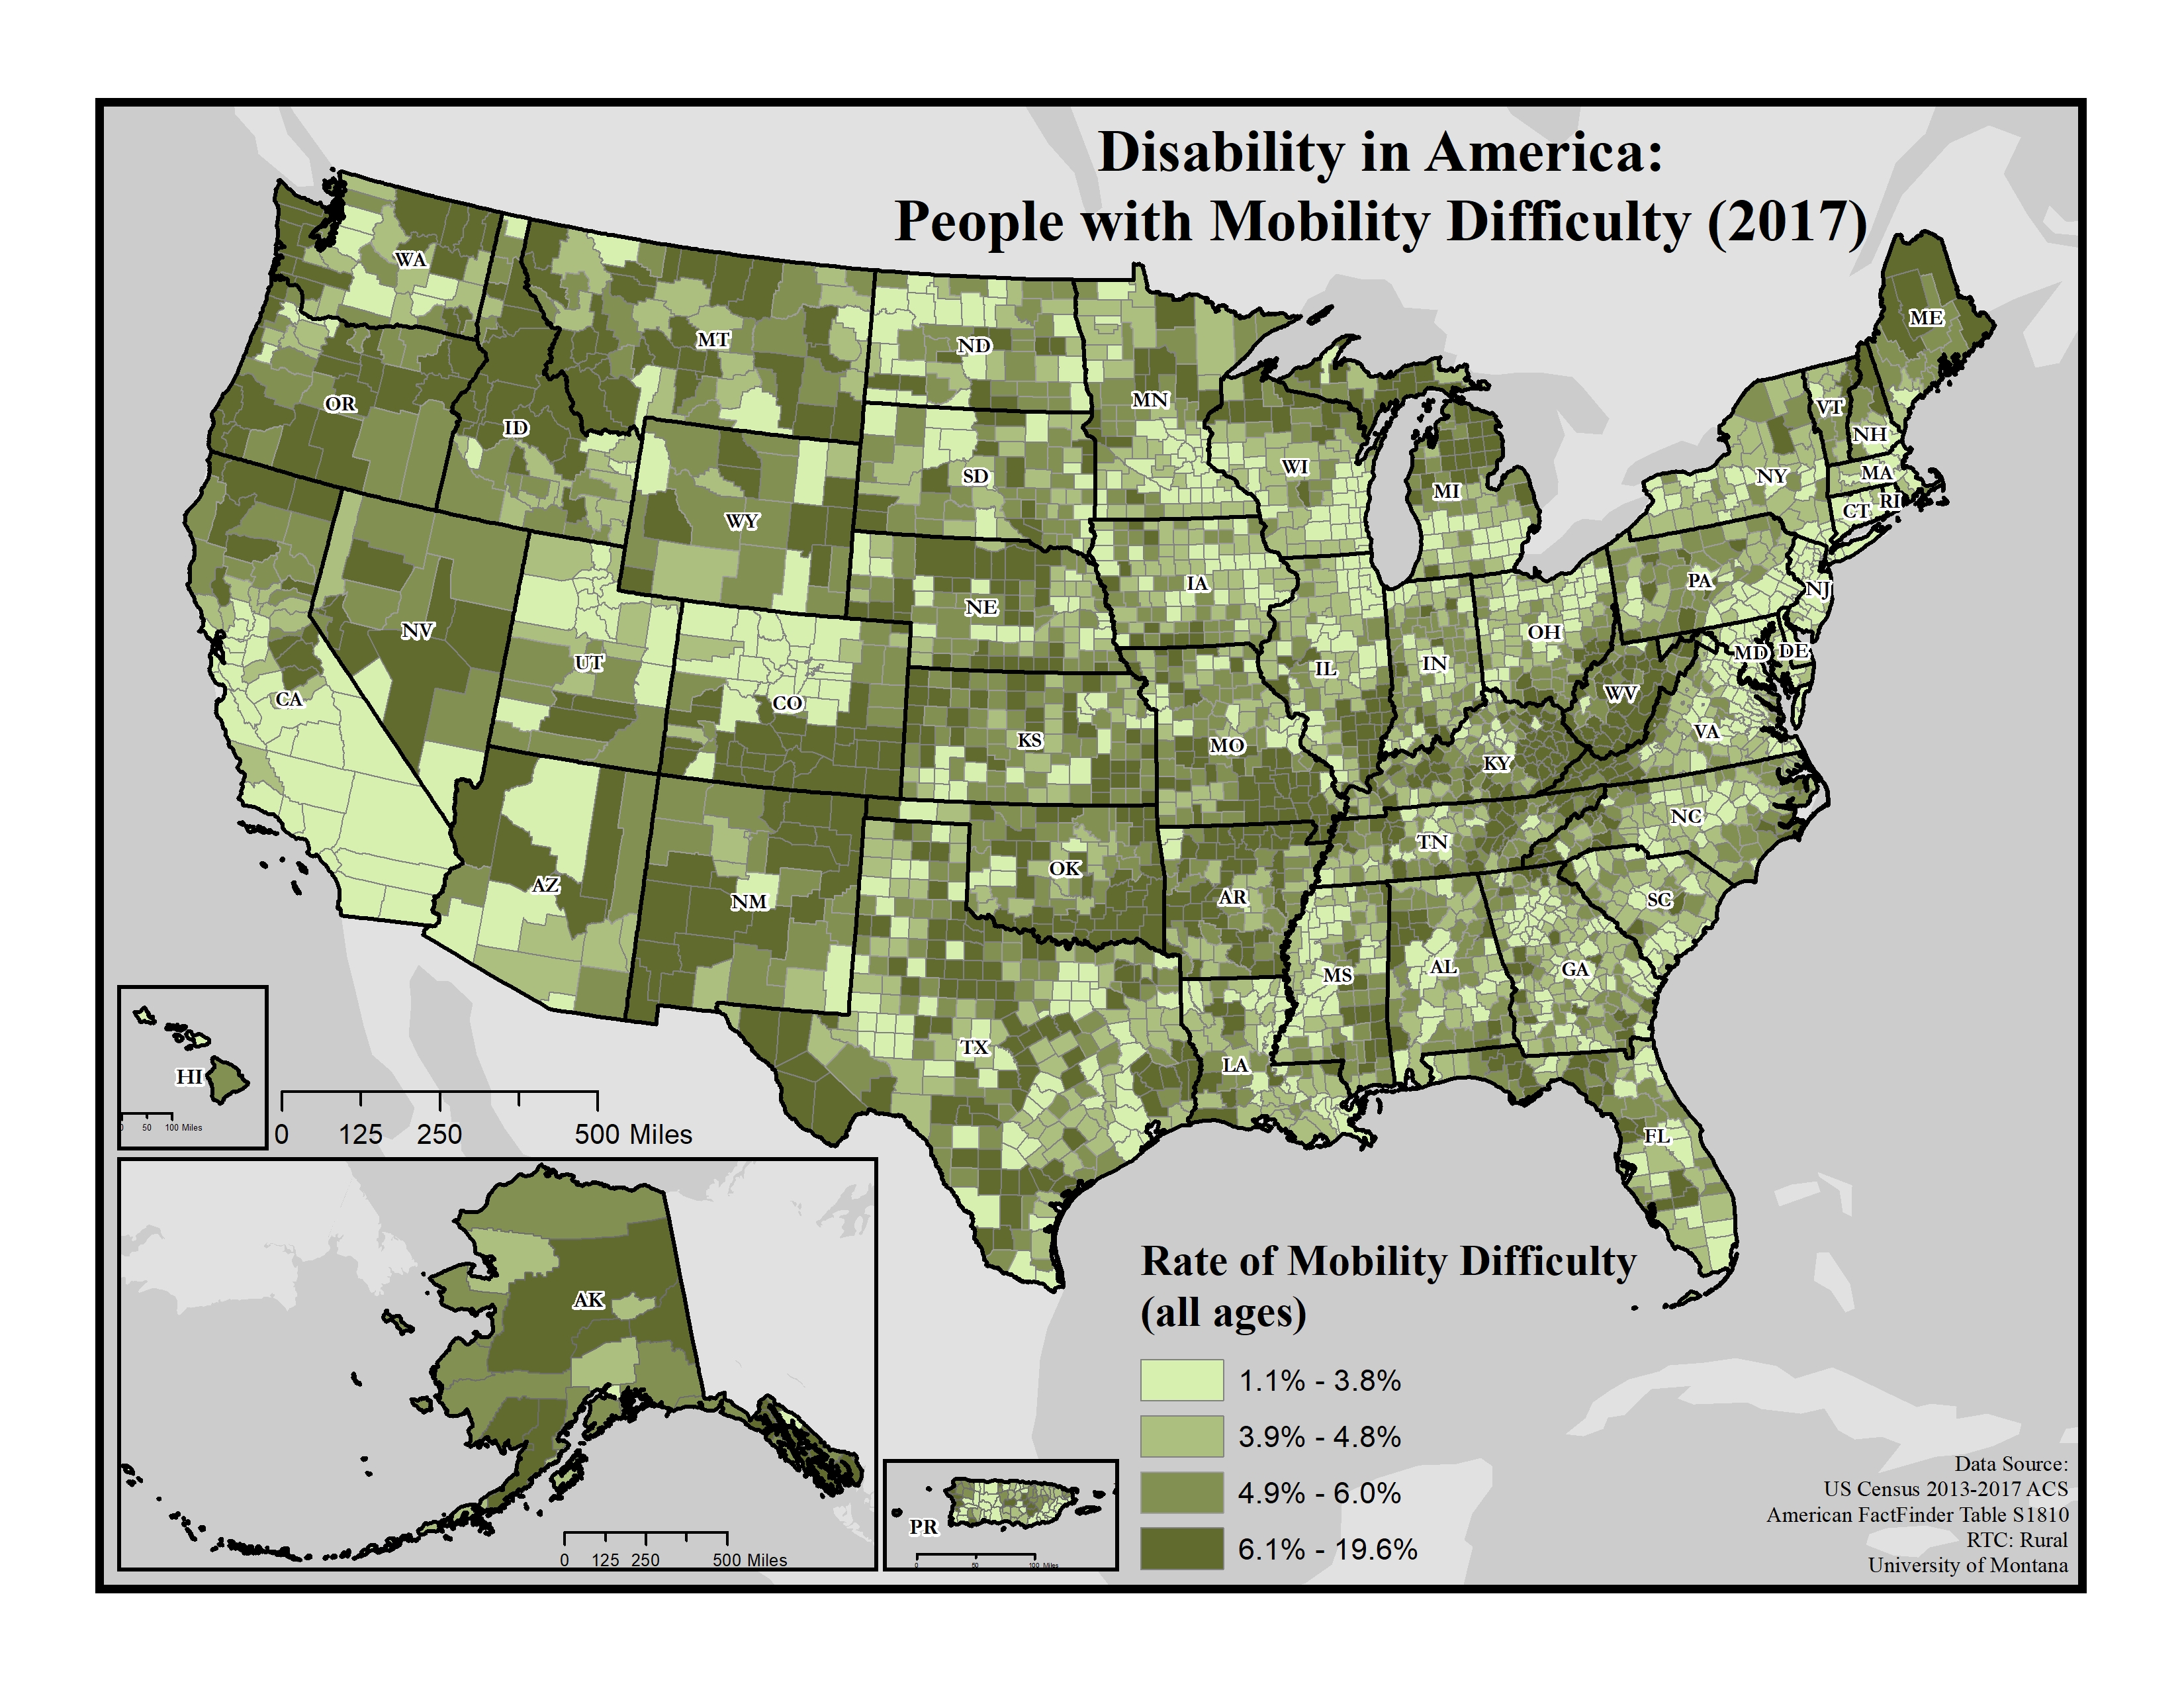
Disability in America: People with Mobility Difficulty (2017)
Displays the rate of people with mobility difficulty on the county level using data from the 2013-2017 American Community Survey (ACS).
Date: 01/2019
Sponsoring organization: Research and Training Center on Disability in Rural Communities
view details
Displays the rate of people with mobility difficulty on the county level using data from the 2013-2017 American Community Survey (ACS).
Date: 01/2019
Sponsoring organization: Research and Training Center on Disability in Rural Communities
view details
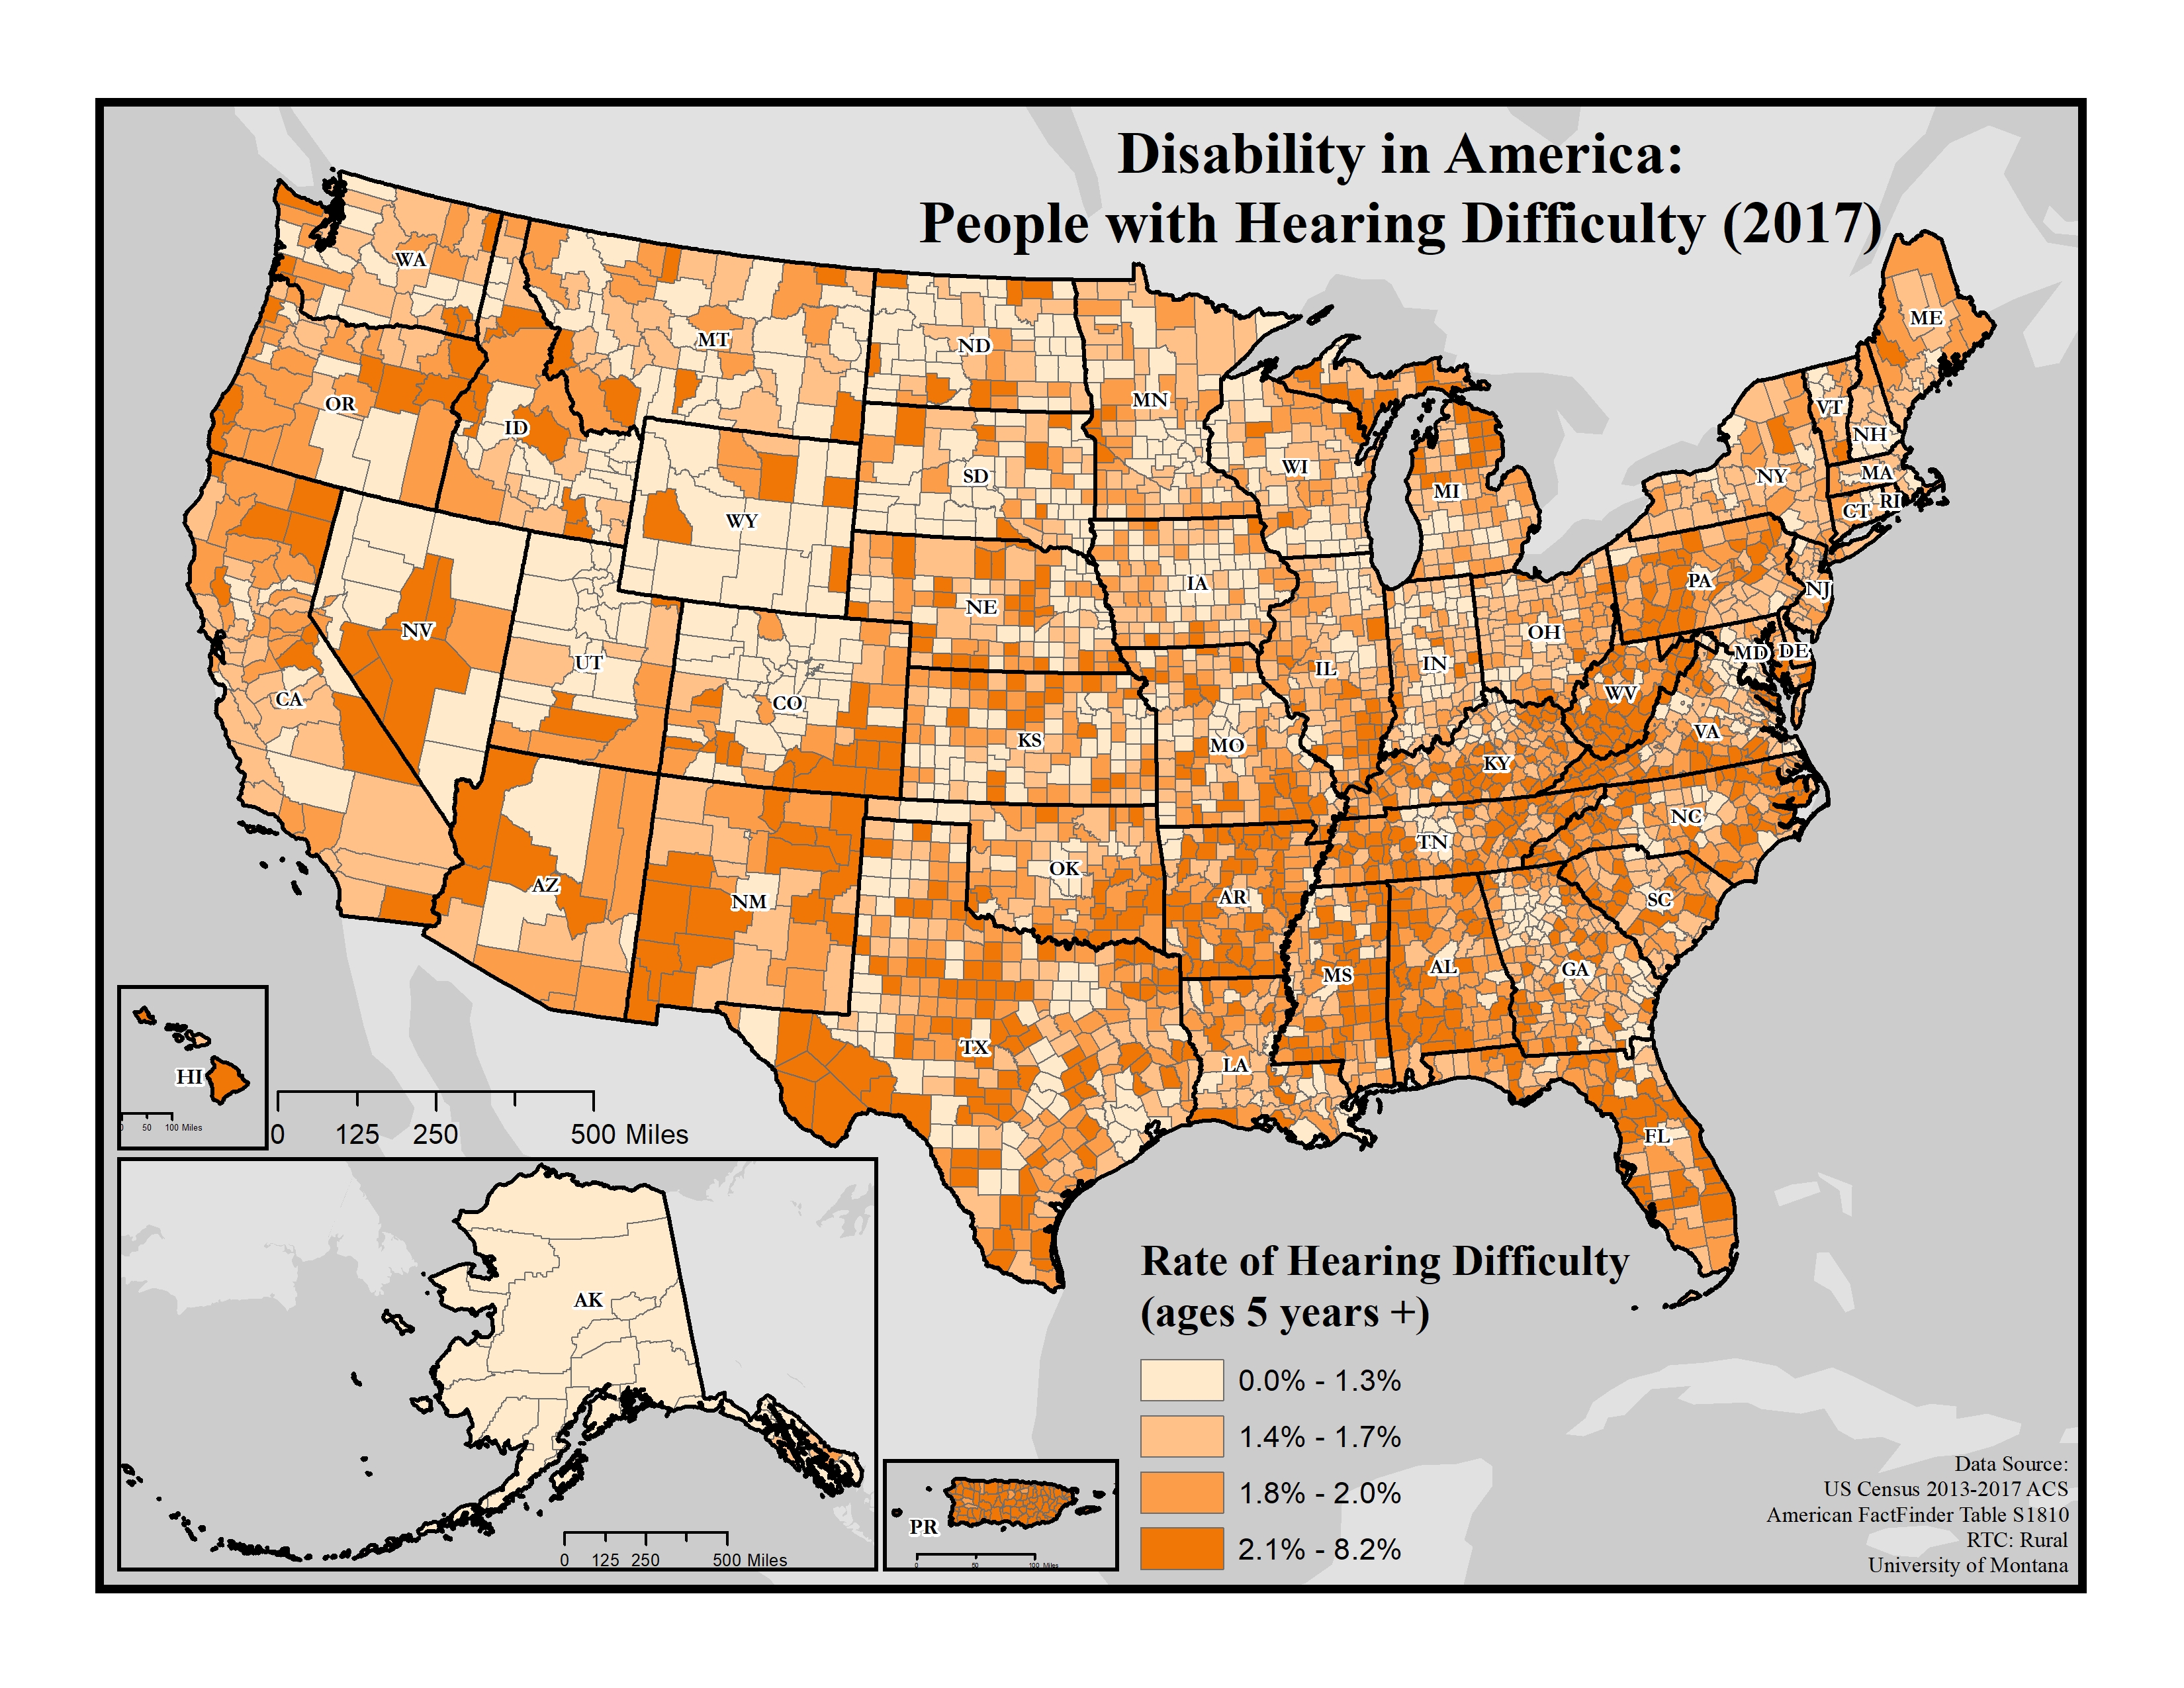
Disability in America: People with Hearing Difficulty (2017)
Displays the rate of people with hearing difficulty on the county level using data from the 2013-2017 American Community Survey (ACS).
Date: 01/2019
Sponsoring organization: Research and Training Center on Disability in Rural Communities
view details
Displays the rate of people with hearing difficulty on the county level using data from the 2013-2017 American Community Survey (ACS).
Date: 01/2019
Sponsoring organization: Research and Training Center on Disability in Rural Communities
view details
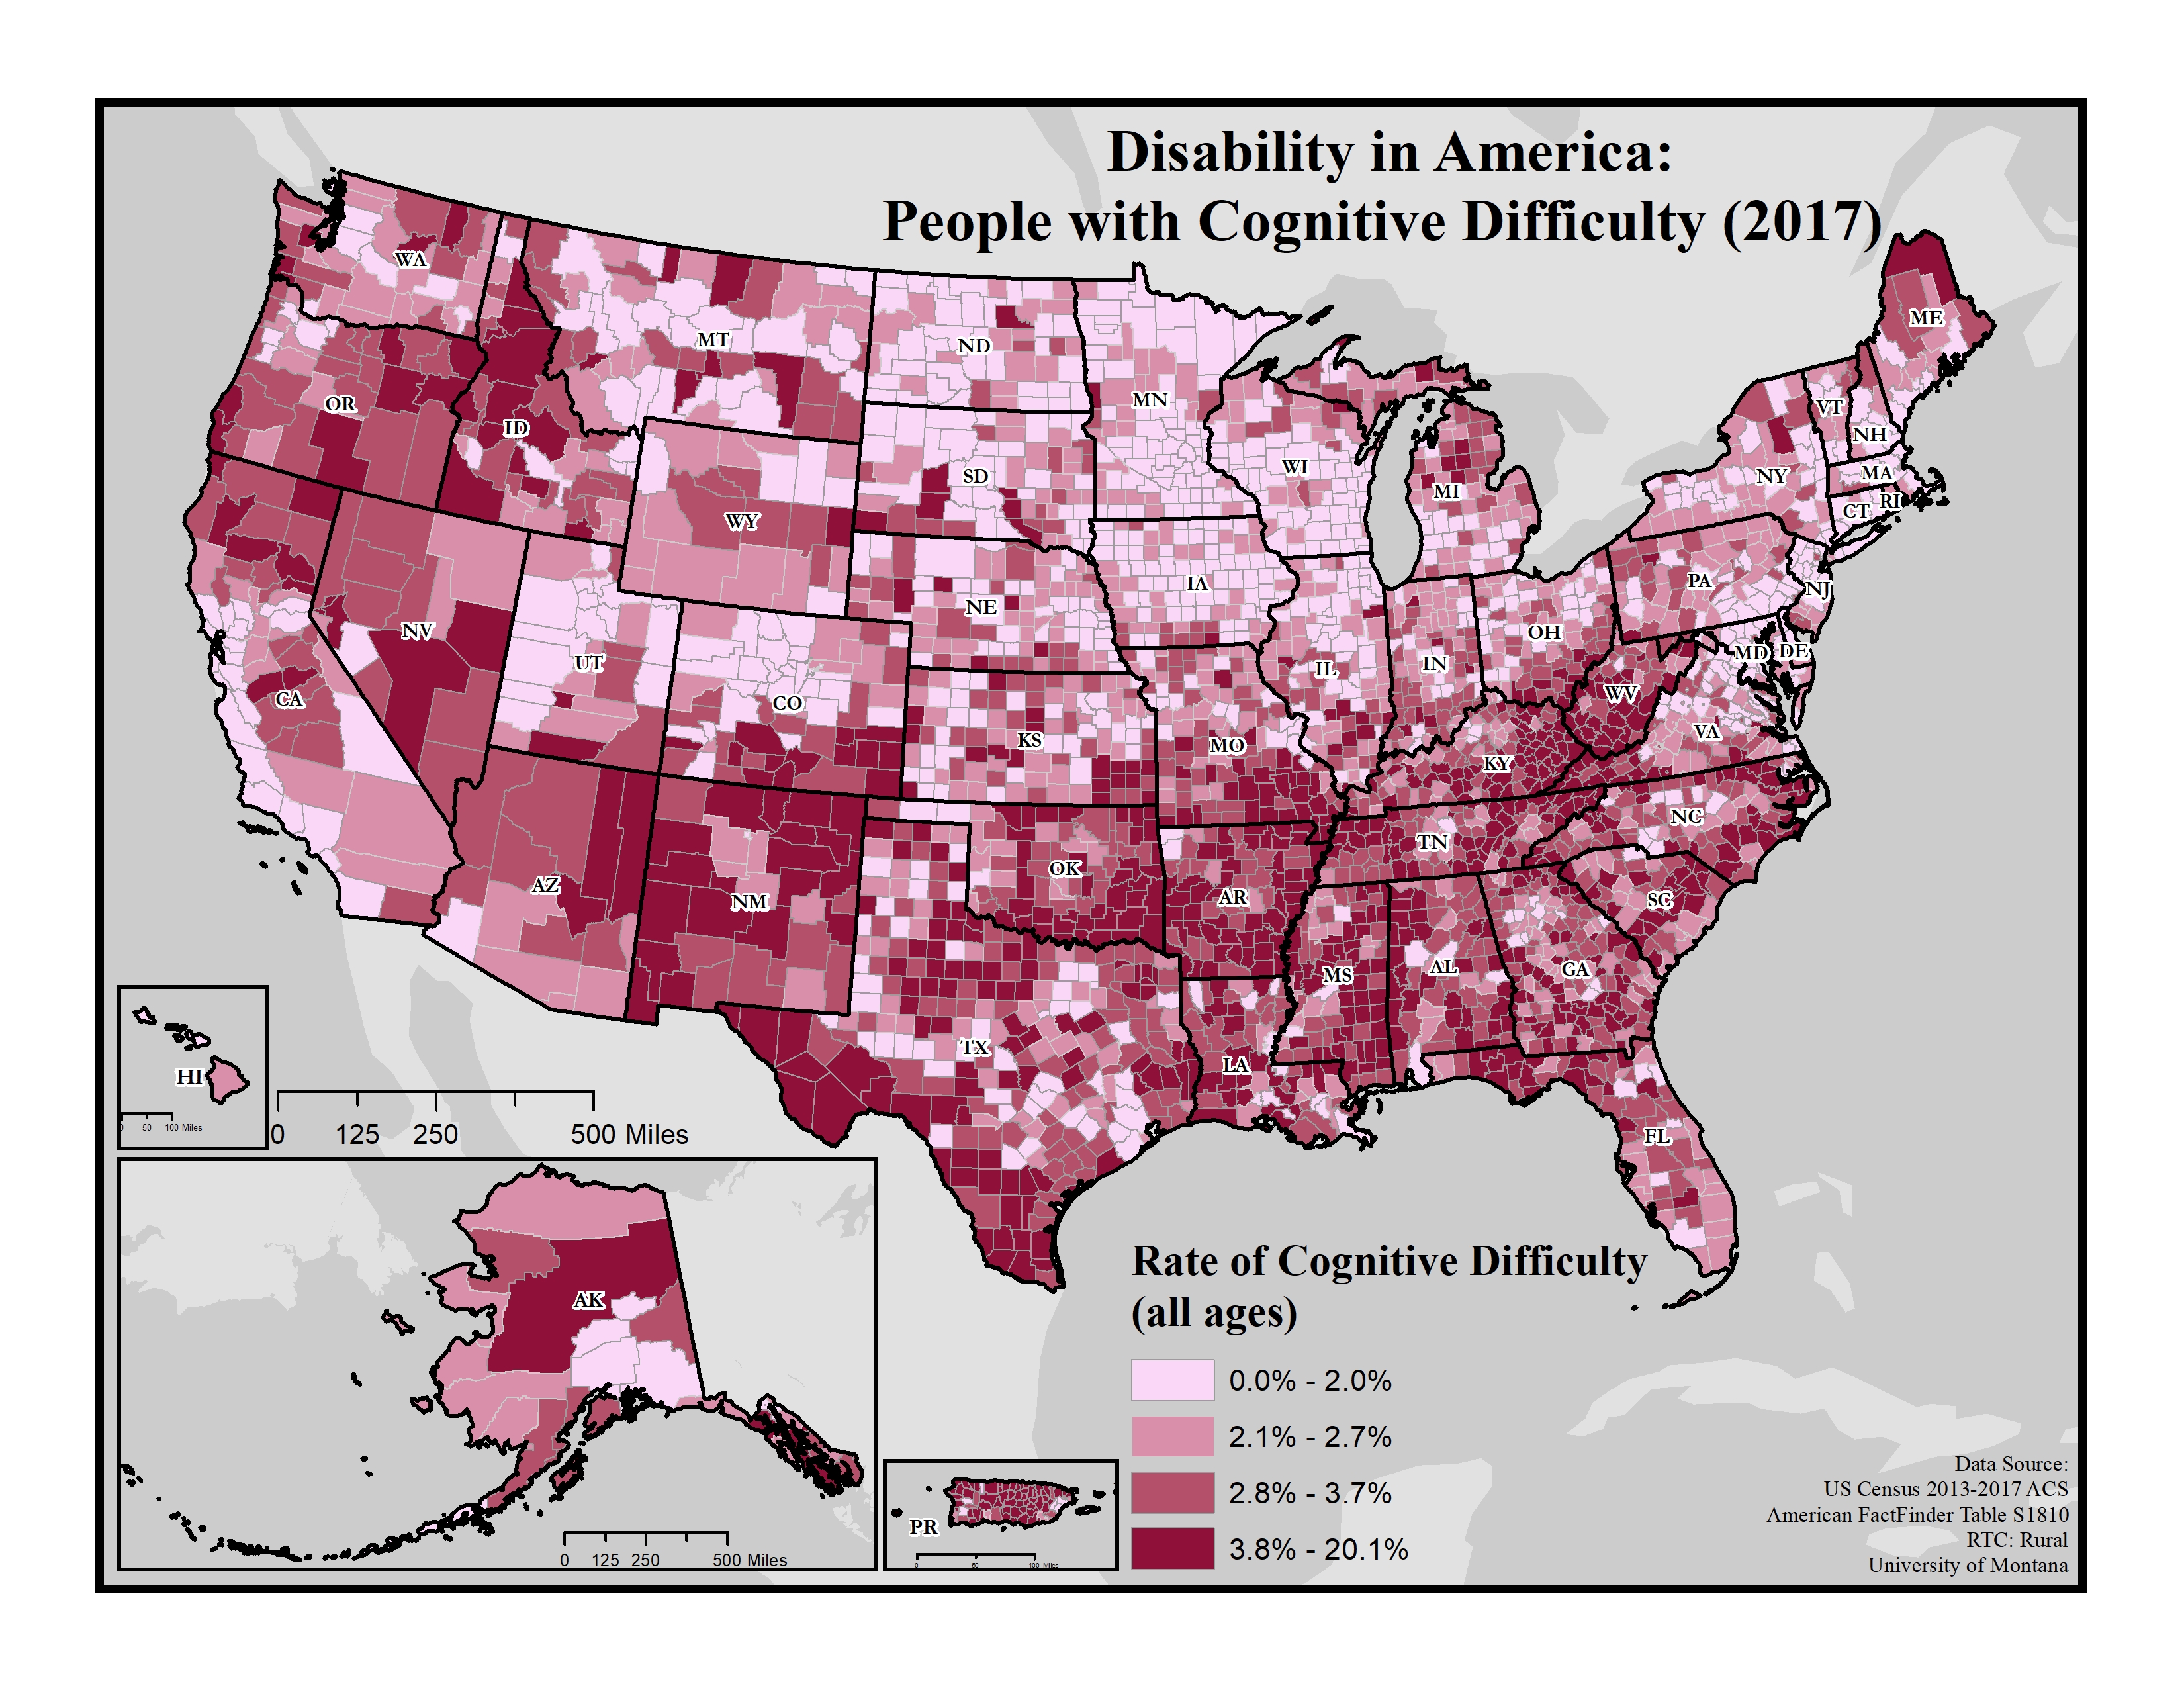
Disability in America: People with Cognitive Difficulty (2017)
Displays the rate of people with cognitive difficulty on the county level using data from the 2013-2017 American Community Survey (ACS).
Date: 01/2019
Sponsoring organization: Research and Training Center on Disability in Rural Communities
view details
Displays the rate of people with cognitive difficulty on the county level using data from the 2013-2017 American Community Survey (ACS).
Date: 01/2019
Sponsoring organization: Research and Training Center on Disability in Rural Communities
view details
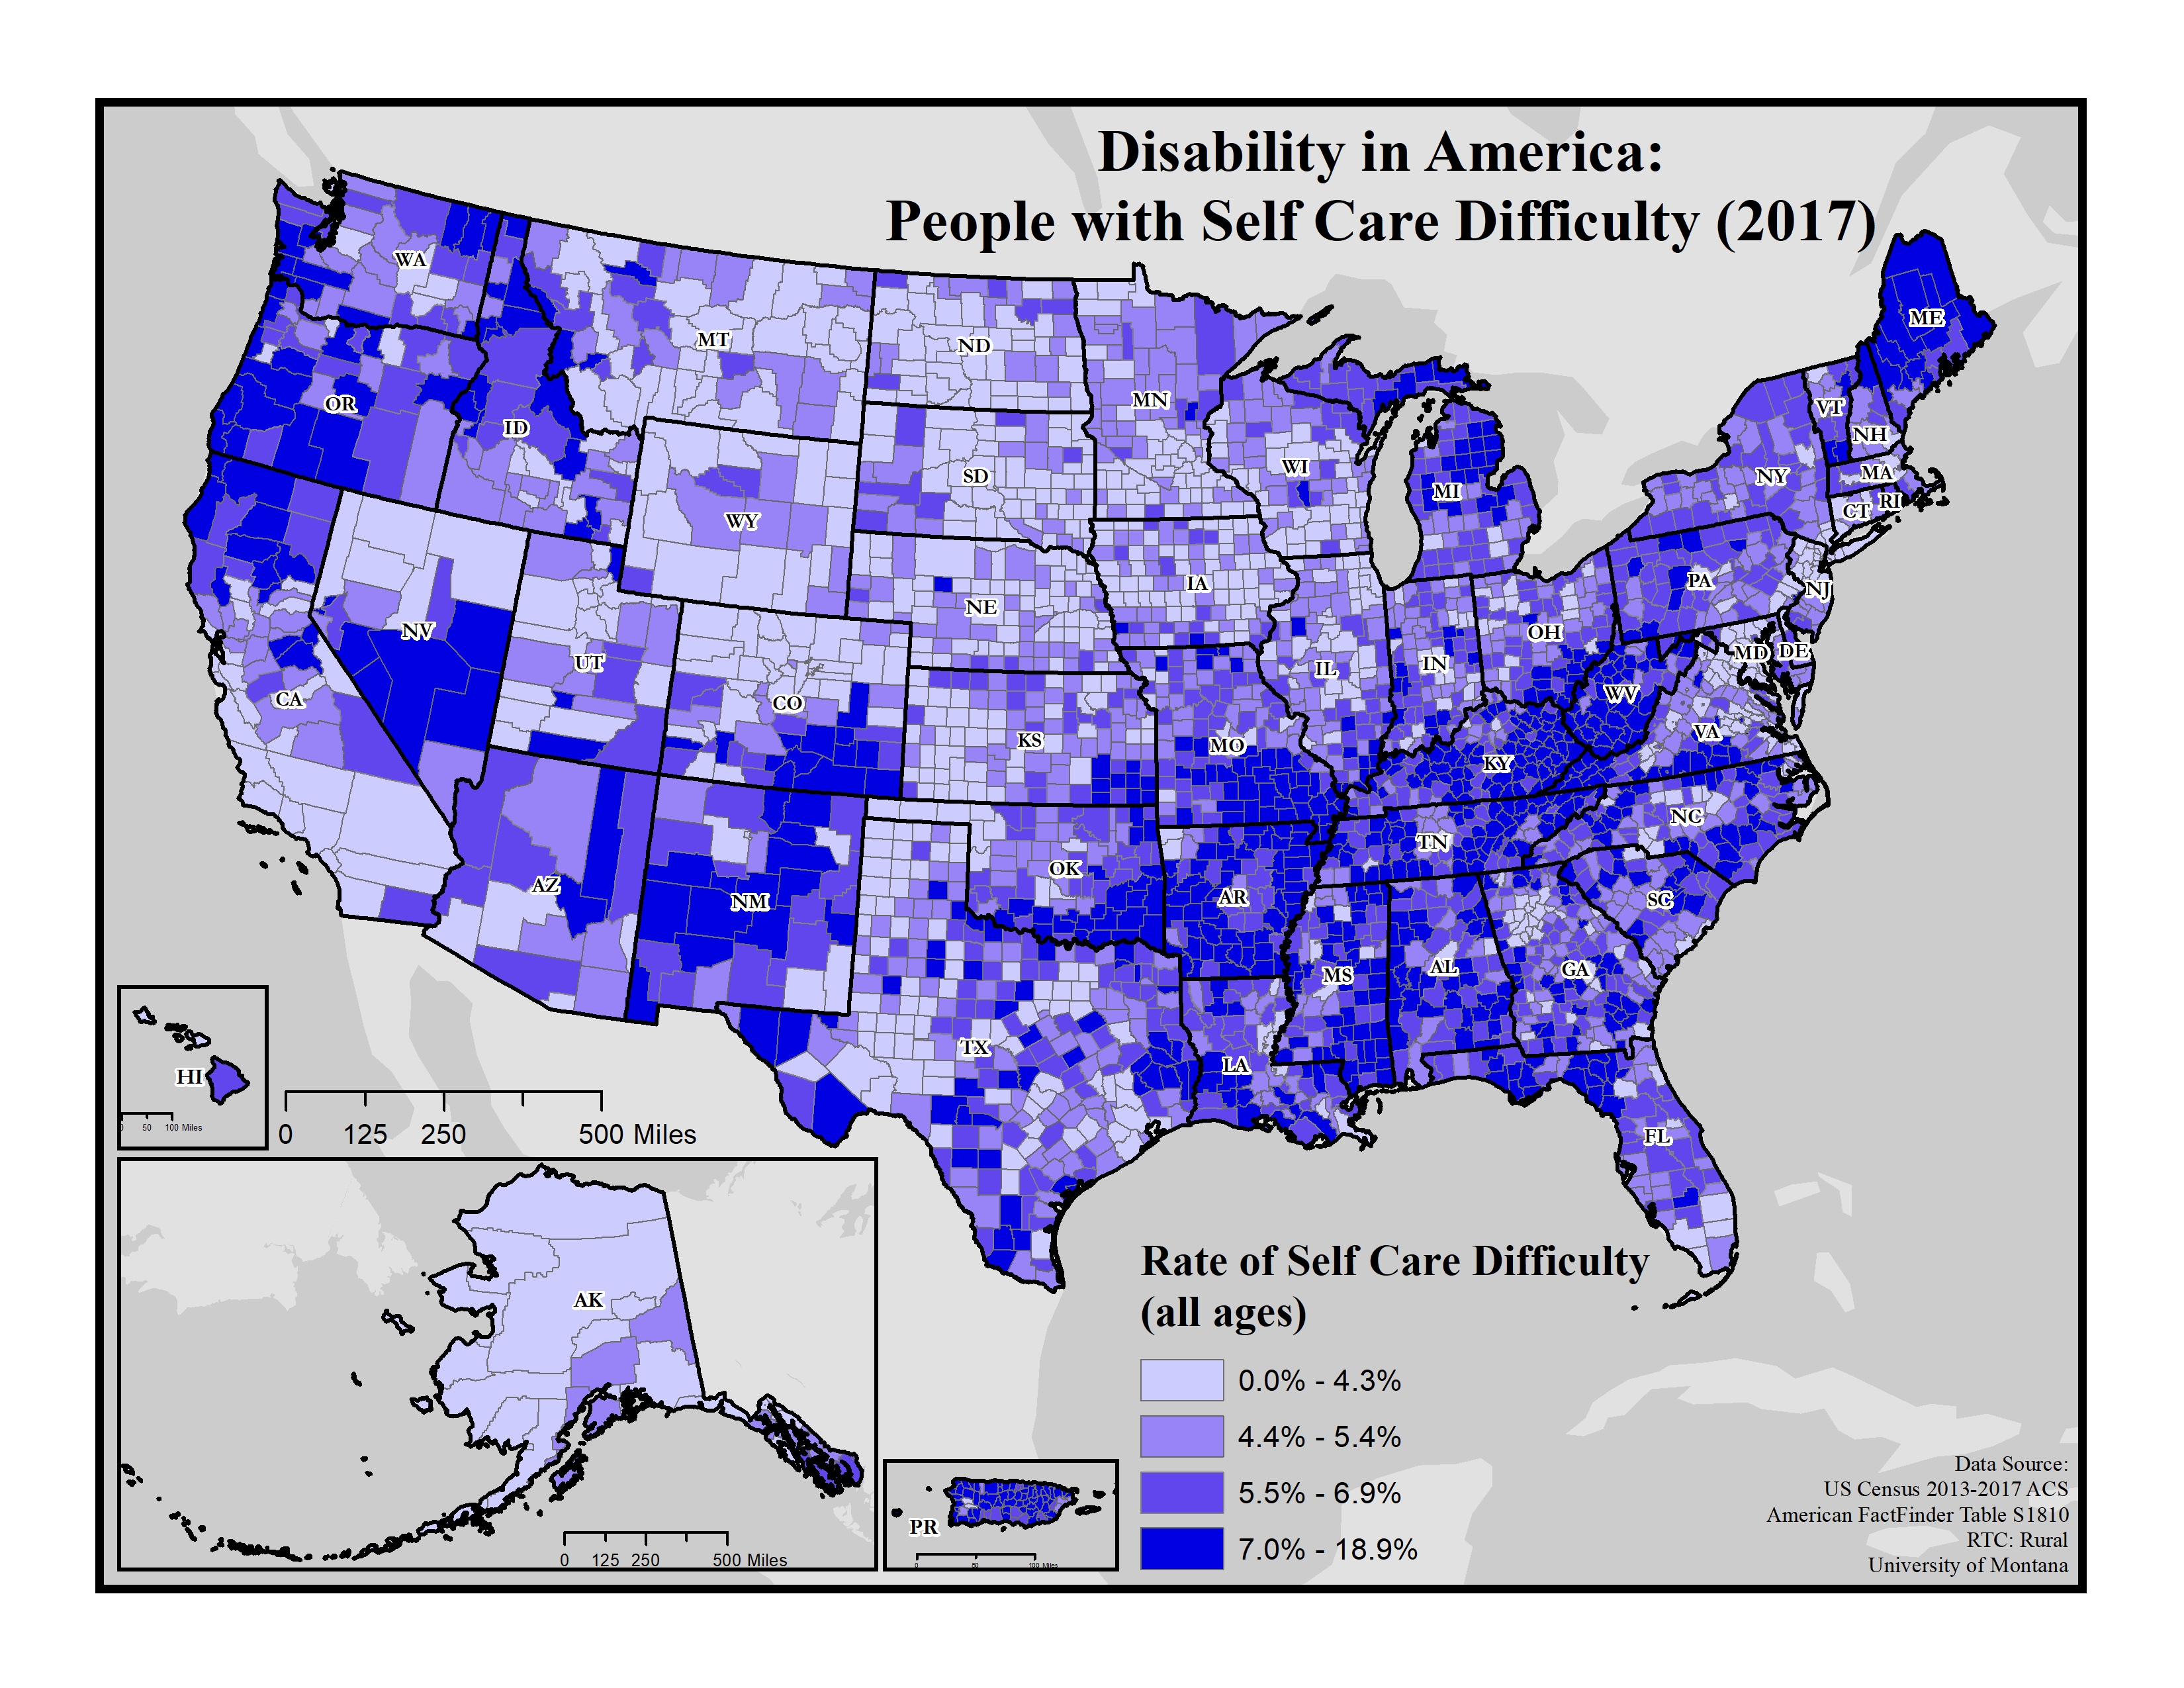
Disability in America: People with Self Care Difficulty (2017)
Displays the rate of people who have difficulty bathing or dressing using county-level data from the 2013-2017 American Community Survey (ACS).
Date: 01/2019
Sponsoring organization: Research and Training Center on Disability in Rural Communities
view details
Displays the rate of people who have difficulty bathing or dressing using county-level data from the 2013-2017 American Community Survey (ACS).
Date: 01/2019
Sponsoring organization: Research and Training Center on Disability in Rural Communities
view details
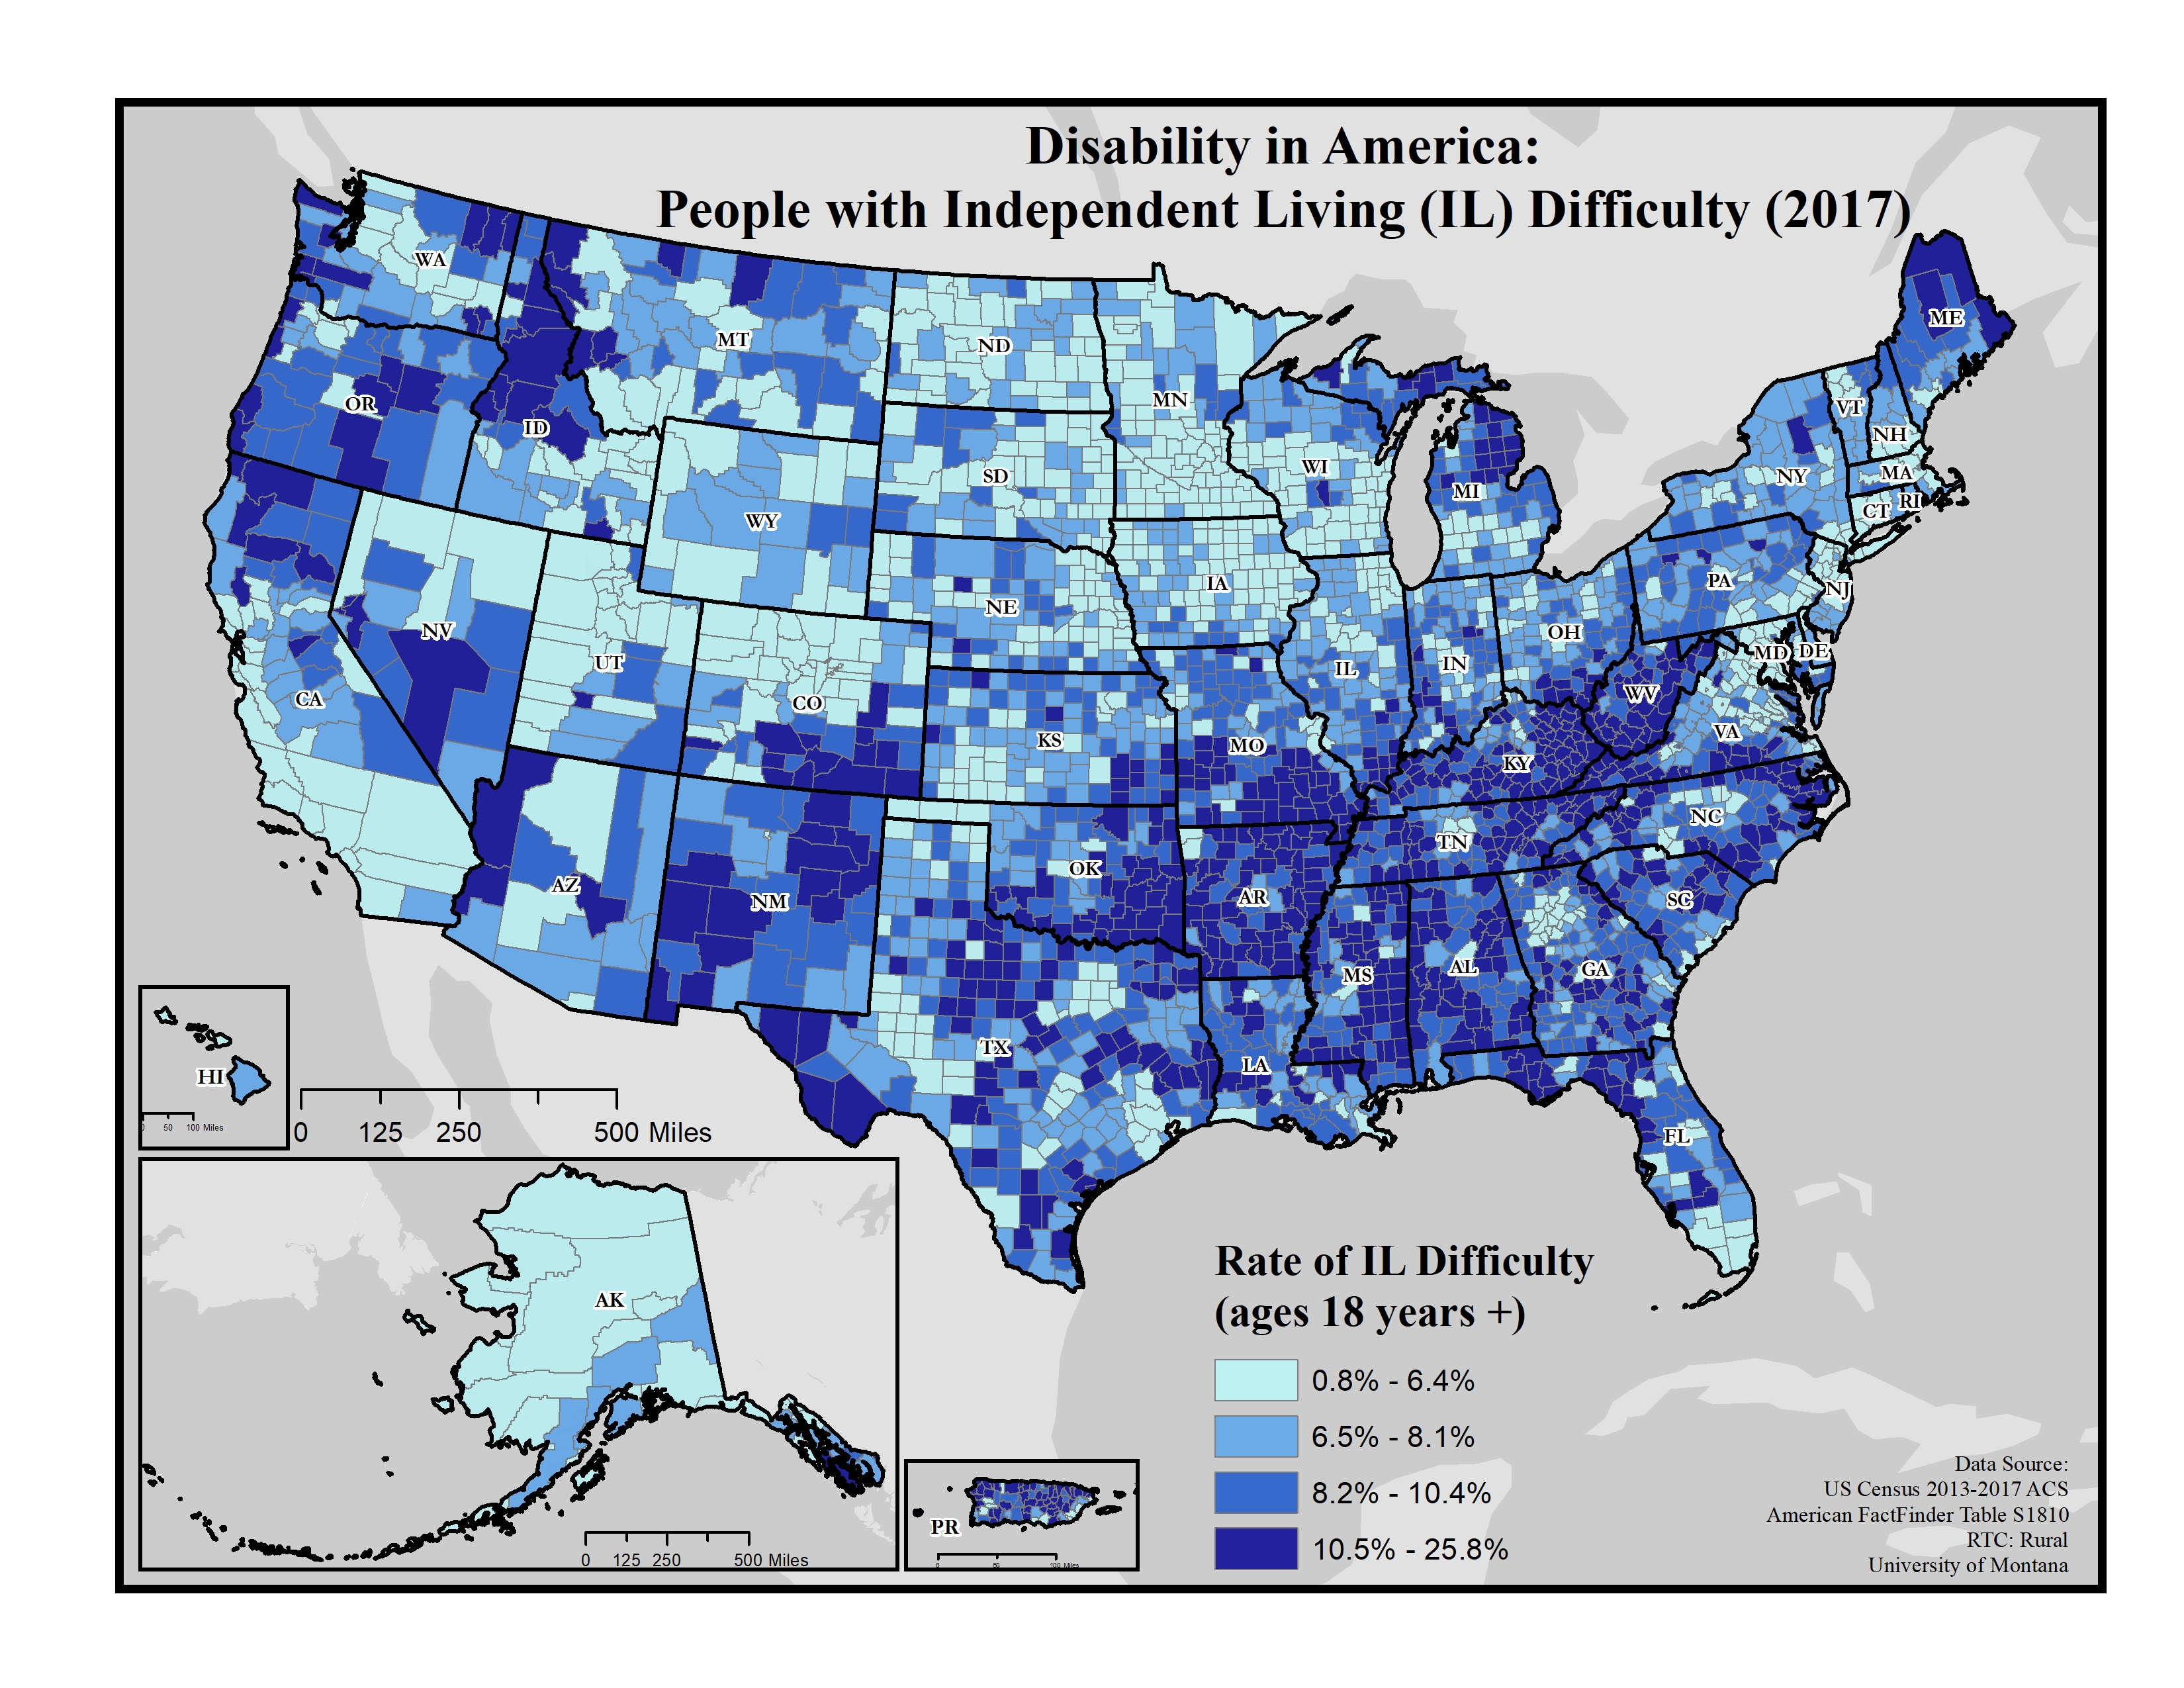
Disability in America: People with Independent Living (IL) Difficulty (2017)
Displays the rate of adults who have difficulty doing errands alone using county-level data from the 2013-2017 American Community Survey (ACS).
Date: 01/2019
Sponsoring organization: Research and Training Center on Disability in Rural Communities
view details
Displays the rate of adults who have difficulty doing errands alone using county-level data from the 2013-2017 American Community Survey (ACS).
Date: 01/2019
Sponsoring organization: Research and Training Center on Disability in Rural Communities
view details