
Rural Health Disparities
Despite the many positive attributes and assets associated with working and living in rural communities, many rural American population groups experience significant health disparities. Health disparities are differences in health status when compared to the population overall, often characterized by indicators such as higher incidence of disease and/or disability, higher mortality rates, lower life expectancies, and higher rates of chronic pain. Rural risk factors for health disparities include geographic isolation, lower socioeconomic status, higher rates of health risk behaviors, limited access to healthcare specialists and subspecialists, and limited job opportunities. Rural residents are also less likely to have employer-provided health insurance coverage, and if they are poor, often are not covered by Medicaid.
Federal and state agencies, membership organizations, and foundations are working to reduce these disparities and improve the health and overall well-being of rural Americans. Some organizations provide funding, information, and technical assistance to be used at the state, regional, and local levels, while others work with policymakers to help them understand the issues affecting population health and healthcare in rural America.
Published in 2017-2018, the Centers for Disease Control and Prevention's (CDC) Morbidity and Mortality Weekly Report (MMWR) Rural Health Series examines rural mortality and preventable deaths, health-related behaviors, chronic disease, mental health services, and other topics related to rural health disparities. In addition to that series, the MMWR continues to publish reports that address rural health. CDC's 2021 report Trends in Death Rates in Urban and Rural Areas: United States, 1999–2019 compares rural and urban mortality rates from the 10 leading causes of death.
Frequently Asked Questions
- What are the causes of rural health disparities?
- How do rural mortality rates compare to urban?
- How does rural health status compare to urban?
- How does rural life expectancy compare to urban?
- How has COVID-19 shed light on rural health disparities?
- What regions of the country experience higher levels of rural health disparities?
- Where can I find supporting documents and statistics on rural health disparities?
- What agencies and organizations are working to seek solutions to these disparities?
- Where can I find programs that illustrate best practices to meet the challenges of providing health services in areas characterized by disparities?
What are the causes of rural health disparities?
The origins of health disparities in rural America are numerous and vary by region. Some frequently cited factors underlying rural health disparities include access to healthcare and public health services, socioeconomic status, health-related behaviors, and chronic conditions, as well as geographic distances, infrastructure limitations, and provider shortages.
Access to Healthcare and Public Health Services
Rural populations can experience many barriers to healthcare access, which can contribute to health disparities. A 2019 JAMA Internal Medicine article, Association of Primary Care Physician Supply with Population Mortality in the United States, 2005-2015, found lower mortality was associated with an increase of 10 primary care physicians per 100,000 population. The following factors create challenges or barriers to accessing healthcare services for rural Americans:
- There are higher rates of uninsured individuals residing outside a metropolitan statistical area compared to their counterparts within metropolitan statistical areas, as reported by the CDC's Health, United States, 2020-21, Table HINone.
- Healthcare workforce shortages are prevalent throughout rural America. A 2024 WWAMI Rural Health Research Center report, Trends in the Health Workforce Supply in the Rural U.S., found that rural counties tend to have more severe workforce shortages than urban counties, and that these shortages have persisted for decades across most clinical specialties. In addition to this maldistribution, nationwide shortages also exist. According to a 2024 report from the Association of American Medical Colleges (AAMC), the U.S. may see a shortage of between 20,200 and 40,400 primary care physicians by 2036.
- Specialty and subspecialty healthcare services are less likely to be available in rural areas and are less likely to include highly sophisticated or high-intensity care. This exacerbates problems for rural patients seeking specialized care who are faced with traveling significant distances for treatment. A 2019 policy brief from the University of Minnesota Rural Health Research Center found that 64% of surveyed Rural Health Clinic staff members reported difficulties finding specialists for patient referral.
- Rural communities have limited access to public health services, with rural-serving public health agencies operating under inadequate funding, unmet technology needs, and limited physical and human infrastructure, as described in Rural Public Health: Improving the Health and Well-Being of Rural Populations, a 2022 policy brief from the National Rural Health Association.
- Notably, reliable transportation can also be a barrier for rural residents accessing healthcare and public health services due to long distances, poor road conditions, and the limited availability of public transportation options in rural areas. For more information on rural transportation programs and the impact of limited transportation options on health in rural communities, see our Transportation to Support Rural Healthcare topic guide.
For additional information regarding access to healthcare and public health services in rural areas and other barriers rural populations face related to access to care, see our Healthcare Access in Rural Communities topic guide and our Rural Public Health Agencies topic guide.
Socioeconomic Status
According to the 2021 Medicaid and CHIP Payment and Access Commission brief Medicaid and Rural Health, rural residents have lower incomes than urban counterparts, and rural areas have overall higher poverty rates. The United Health Foundation's Health Disparities Report 2021 includes rural and urban comparative data on social and economic factors impacting health disparities. The report finds that between 2015-2019, rural populations had higher rates of poverty and premature death than their urban counterparts.
The Neighborhood Atlas from the University of Wisconsin School of Medicine and Public Health offers Area Deprivation Index (ADI) data at the census block level. CDC's Social Vulnerability Index (SVI) offers county-level comparisons of socioeconomic data, household composition, housing and transportation data, and more.
Socioeconomic status and related challenges can fall under social determinants of health (SDOH). Healthy People 2030 defines social determinants of health as "the conditions in the environments where people are born, live, learn, work, play, worship, and age that affect a wide range of health, functioning, and quality-of-life outcomes and risks." Social determinants of health can include income and poverty, housing conditions, educational attainment, access to healthcare, health literacy, environmental health, and other factors that impact the attainment of health and wellness. For additional information about the causes of health disparities in rural areas, see our Social Determinants of Health for Rural People topic guide.
Health Insurance Status
The 2022 report Geographic Variation in Health Insurance Coverage: United States, 2020 found that 58.5% of rural adults and 43.5% of rural children held private insurance coverage in 2020, while 26.3% of rural adults and 52.0% of rural children held public coverage and 17.9% of rural adults and 7.7% of rural children were uninsured. Compared to medium, small, large fringe, and large central metropolitan populations, rural individuals had the lowest rate of private insurance coverage, the highest rates of public coverage, and the highest uninsured status.
For more health insurance data, the State Health Access Data Assistance Center (SHADAC) offers a state-by-state tool that presents data on health insurance coverage, access to care, affordability, and healthcare utilization. The U.S. Census Bureau's Small Area Health Insurance Estimates (SAHIE) Program offers a visualization of health insurance coverage from 2008-2020 that depicts the proportion of persons uninsured under age 65 by county.
Health Behaviors
The adoption of positive health behaviors at the community level can have an impact on the rates of disparities in health status and mortality. A 2017 CDC MMWR, Health-Related Behaviors by Urban-Rural County Classification — United States, 2013, examined the prevalence of 5 key positive health-related behaviors by urban-rural status. Urban residents were more likely to report 4 or 5 of these health behaviors.
| Behavior | Large metro center | Large fringe metro | Medium metro | Small metro | Micropolitan | Noncore |
|---|---|---|---|---|---|---|
| Current nonsmoking | 83.9% | 82.3% | 80.5% | 77.5% | 76.5% | 74.9% |
| Non- or moderate drinking | 61.1% | 59.9% | 63.3% | 64.3% | 67.3% | 68.6% |
| Maintaining normal body weight | 36.5% | 35.3% | 33.3% | 32.9% | 30.6% | 28.9% |
| Meeting aerobic activity recommendations | 51.4% | 51.4% | 51.1% | 50.7% | 49.2% | 46.7% |
| Sufficient sleep | 62.4% | 61.7% | 62.4% | 62.1% | 61.1% | 61.5% |
| Reported 4 or 5 of these health-related behaviors | 31.7% | 30.2% | 30.5% | 29.5% | 28.8% | 27.0% |
| Source: Health-Related Behaviors by Urban-Rural County Classification — United States, 2013, CDC Morbidity and Mortality Weekly Report | ||||||
A 2019 American Journal of Public Health study found that from 2008-2010 and 2014-2016, rates of cigarette smoking among rural and urban adolescents declined, but that rural rates fell more slowly than urban rates. In 2014-2016, rural youth had 50% higher odds of smoking cigarettes than urban adolescents.
The 2019 National Healthcare Quality and Disparities Report: Chartbook on Rural Health Care from the Agency for Healthcare Research and Quality includes a section on healthy living, covering data on health behaviors, smoking, and other health disparity data with rural and urban comparisons throughout.
How do rural mortality rates compare to urban?
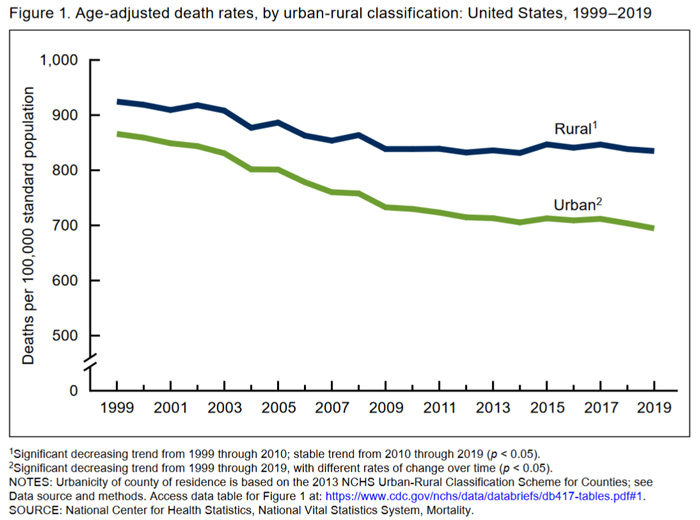
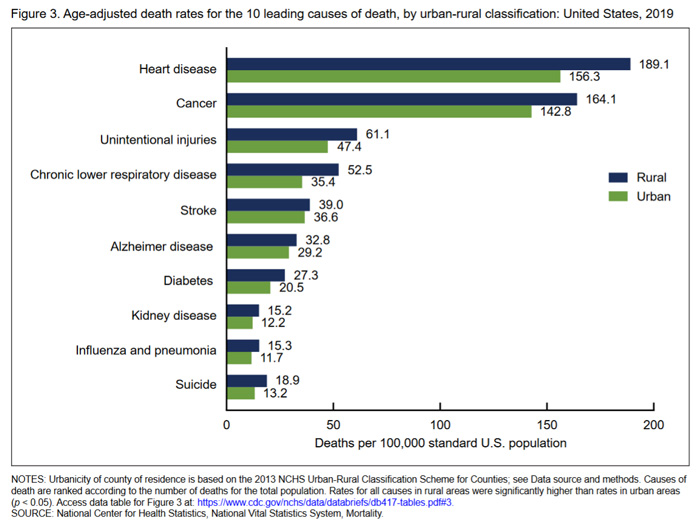
According to a 2021 National Center for Health Statistics (NCHS) data brief, Trends in Death Rates in Urban and Rural Areas: United States, 1999–2019, the age-adjusted death rate in rural areas was 7% higher than that of urban areas, and by 2019 rural areas had a 20% higher death rate than urban areas. The brief found that the largest urban-rural differences in deaths were from heart disease, cancer, and chronic lower respiratory disease.
With all-cause mortality rates higher in rural areas, it is no surprise that mortality related to certain causes are also higher in rural areas. The table below from the NCHS brief compares several cause-specific mortality rates for rural and urban counties.
Another way to examine rural-urban mortality differences is by examining potentially excess deaths, which are those deaths that might have been preventable. A 2019 CDC MMWR, Potentially Excess Deaths from the Five Leading Causes of Death in Metropolitan and Nonmetropolitan Counties — United States, 2010–2017, analyzed CDC National Vital Statistics System data and determined the 5 leading causes of death in the U.S. continue to demonstrate higher percentages of excess deaths for populations in nonmetropolitan areas than in metropolitan areas. The article defines excess deaths as deaths among people under 80 years of age that exceed the expected number of deaths. Across counties in the U.S., the proportion of deaths that occur before age 80 varies; the three states with the lowest rates are used as a benchmark for comparison.
| Cause of Death | Noncore | Micropolitan | Small Metro | Medium Metro | Large Fringe Metro | Large Central Metro |
|---|---|---|---|---|---|---|
| Heart Disease | 44.9% | 41.8% | 34.8% | 30.1% | 18.5% | 28.0% |
| Cancer | 21.7% | 19.9% | 13.5% | 10.3% | 4.0% | 3.2% |
| Unintentional injury | 64.1% | 61.1% | 55.5% | 57.6% | 50.6% | 47.8% |
| Chronic lower respiratory disease | 57.1% | 54.6% | 47.2% | 39.8% | 23.4% | 13.0% |
| Stroke | 37.8% | 35.0% | 31.4% | 28.9% | 17.0% | 27.4% |
| Source: CDC MMWR, Potentially Excess Deaths from the Five Leading Causes of Death in Metropolitan and Nonmetropolitan Counties — United States, 2010–2017. | ||||||
The 2020 study Rural-Urban Residence and Mortality among Three Cohorts of U.S. Adults examines hazard of death data for rural and urban respondents to a national survey in three birth cohorts: those born between 1912-1944, 1945-1964, and 1965-1986. The study found that the risk of death at any point between 1997-2011 was 10% higher for rural respondents. For a regional analysis, see the North Carolina Rural Health Research Center's Regional Difference in Rural and Urban Mortality Trends, which examines urban and rural mortality rates from 1999-2015.
4 of the 5 leading causes of death in rural areas are associated with chronic disease. Our Chronic Disease in Rural America topic guide provides additional information and resources on the impact of chronic disease in rural areas and lists funding opportunities for programs to address chronic conditions in rural areas.
How does rural health status compare to urban?
In general, rural populations experience worse health status than urban populations. This is in part due to a higher incidence of chronic conditions, higher engagement in health risk behaviors, and lower access to healthcare services. According to the 2024 research report Access to Health Care in Rural America: Current Trends and Key Challenges, rural populations experience higher rates of uninsurance, lower healthcare workforce availability, and travel greater distances to access care relative to their urban counterparts. Rural populations also have higher rates of disability, according to a 2019 American Journal of Preventive Medicine article that found rural adults were 9% more likely to report a disability, and 24% more likely to report 3 or more disabilities. The CDC's Disability and Health Promotion website offers more information on this study and its implications.
Age-adjusted health status data from the National Health Interview Survey, 2018 shows that 11.2% of respondents who live outside a metropolitan statistical area (MSA) reported their health status as "fair" or "poor" compared to 9.6% of respondents in small MSAs and 8.4% of respondents from large MSAs. Moreover, 39.3% of large MSA respondents claimed "excellent" health compared to 34.7% of small MSA respondents and 31.2% of respondents not residing in an MSA.
While rural health status is generally poorer than in more populated areas, health status disparities can vary based on socioeconomic factors, access to outdoor spaces for physical activity, and state-level wellness and disease prevention efforts. For state-level data, see the Kaiser Family Foundation's State Health Facts, which offer data on demographics, health status, healthcare access, including state profiles and comparisons across the 50 states.
Rural community-based and other rural-serving organizations are working to address these issues through investments in rural community assets, economic development, food security and nutrition, and public health efforts. For more information on this work, see our Community Vitality and Rural Healthcare topic guide.
How does rural life expectancy compare to urban?
Related to excess deaths, life expectancy is generally lower in rural than in urban counties.
| Sex and Urbanization | LE in 1999 | LE in 2010 | LE in 2019 |
|---|---|---|---|
| Rural Women | 55.11 | 55.78 | 55.58 |
| Urban Women | 55.64 | 57.52 | 58.07 |
| Rural Men | 49.76 | 51.13 | 50.82 |
| Urban Men | 50.76 | 53.07 | 53.36 |
| Source: International Journal of Epidemiology, The Growing Rural–Urban Divide in US Life Expectancy: Contribution of Cardiovascular Disease and Other Major Causes of Death. | |||
The Robert Wood Johnson Foundation (RWJF) and the National Association of Public Health Statistics and Information Systems (NAPHSIS) have worked together to launch the U.S. Small-area Life Expectancy Estimates Project (USALEEP). USALEEP offers national and state-level data files for life expectancy and an abridged period life table describing life expectancy at birth from 2010 through 2015. RWJF's interactive tool, Life Expectancy: Could Where You Live Influence How Long You Live?, uses the USALEEP data analysis to determine the life expectancy for where you live at the neighborhood level. You can search by ZIP code or street address for life expectancy data and a comparison by census tract, county, state, and the national life expectancy.
How has COVID-19 shed light on rural health disparities?
The COVID-19 pandemic drew attention to chronic conditions affecting many Americans, including diabetes, cancer, lung diseases, and heart conditions, that are risk factors for severe illness due to COVID-19. Rural areas tend to have higher rates of these conditions compared to metropolitan areas, and per capita rural counties have seen higher rates of COVID-19 deaths compared to urban areas, according to the CDC's COVID Data Tracker. In addition, the 2020 MMWR article Estimated County-Level Prevalence of Selected Underlying Medical Conditions Associated with Increased Risk for Severe COVID-19 Illness — United States, 2018 examines underlying medical conditions that contribute to the risk of severe COVID-19 infection and mortality, with county-level estimates as well as metro and nonmetro comparisons. For more information on chronic conditions, see our Chronic Disease in Rural America topic guide.
The 2021 report Rural Communities at Risk: Widening Health Disparities Present New Challenges in Aftermath of Pandemic examines gaps in rural and urban access to primary care and mental health services, identifying significant vulnerabilities in rural communities to health emergencies like the COVID-19 pandemic that increase the risk for rural health disparities. The report also notes the risk of healthcare facility closures in rural areas, which is an additional source of vulnerability for those communities. Additionally, a 2021 Journal of Rural Health article notes that disparities in healthcare access that existed before the pandemic were made more severe during the pandemic, including aging rural hospital infrastructure, less access to ICU beds and ventilators, and less access to specialty care.
What regions of the country experience higher levels of rural health disparities?
Higher levels of rural health disparities can be found in several regions throughout the U.S., although not all of these regions exhibit similarly high levels in all identified disparities.
The South
The rural South leads in mortality rates for nearly all top-ten causes of death examined by the Rural Health Reform Policy Research Center (RHRPRC). According to a dynamic data visualization supplement to the 2019 CDC report Potentially Excess Deaths from the Five Leading Causes of Death in Metropolitan and Nonmetropolitan Counties — United States, 2010–2017, the percentages of potentially excess deaths were higher in the Southeastern U.S. than other regions. The visualization also presents state-level data on excess deaths from cancer, chronic lower respiratory disease, heart disease, stroke, and unintentional injury. The Institute for Health Metrics and Evaluation (IHME) U.S. Health Map provides data on life expectancy at birth for both sexes in 2019 that illustrates a lower life expectancy in the South. See Resources by Topic: The South for additional information and Rural Project Examples: The South for examples of programs working to decrease disparities.
Appalachia
There are many areas of overlap between Appalachia and the South, and Appalachia exhibits many of the same health disparities found in the South. A 2017 Health Affairs article, Widening Disparities in Infant Mortality and Life Expectancy Between Appalachia and the Rest of the United States, 1990–2013, identified infant mortality rates 16% higher in the Appalachian region compared to the U.S. as a whole from 2009 to 2013. The article reports that the deficit in life expectancy for residents of Appalachia widened by 2.4 years from 1990 to 1992. The 2025 NORC Walsh Center for Rural Health Analysis and East Tennessee State University Center for Rural Health Research report, Appalachian Diseases of Despair, found that in 2023 Appalachia had a higher all-cause mortality rate of 400.9 deaths per 100,000 than the non-Appalachian U.S., which had a rate of 304.3 deaths per 100,000. Mortality from overdose, suicide, and alcoholic liver disease was 100.0 deaths per 100,000, compared with 73.0 deaths per 100,000 in the non-Appalachian United States. A research product from RHRPRC, Exploring Rural and Urban Mortality Differences in the Appalachian Region, reports mortality rates for cancer, heart disease, diabetes, lower respiratory diseases, unintentional injury, and stroke are higher in Appalachia compared to the U.S. as a whole. The American Psychiatric Association's (APA) 2017 publication Mental Health Disparities: Appalachian People reports the "region's suicide rate is 17% higher than the national rate" and rural Appalachian residents are 21% more likely to die by suicide compared to their counterparts residing in larger metro counties in the region. Additional information and data on Appalachian health disparities can be found in the 2017 report Health Disparities in Appalachia from the Appalachian Regional Commission and the Cecil G. Sheps Center for Health Services Research. See Resources by Topic: Appalachia for additional information and Rural Project Examples: Appalachia for examples of programs working to decrease disparities.
The Delta Region
The Delta Region is located in the South but is limited to the rural geographic areas along the Mississippi River. The Delta Region exhibits many of the same health disparities as the rural South and Appalachia. IHME's U.S. Health Map offers data describing life expectancy at birth for both sexes in 2014 in the Delta Region, which are some of the lowest in the country. For example, the life expectancy for males at birth in 2014 in Coahoma County, Mississippi is 67.24 years compared to 76.71 years for males born anywhere in the U.S. in 2014. The life expectancy for females at birth in 2014 in Madison Parish, Louisiana is 74.21 years compared to 81.45 years for females born anywhere in the U.S. in 2014. The RHRPRC research product, Exploring Rural and Urban Mortality Differences in the Delta Region, reports rural mortality rates from heart disease for all age groups are higher in the Delta Region compared to the U.S. as a whole. See Resources by Topic: Delta Region for additional information.
U.S.-Mexico Border
The U.S.-Mexico border region experiences persistent health issues related to environmental, infrastructural, and population-based factors. The 2021 Rural Border Health Chartbook offers data on health indicators, disparities, and social determinants of health in rural border and non-border counties in Texas, New Mexico, Arizona, and California, covering access to care, preventive services, health behaviors, and mortality. The 2015 United States-México Border Health Commission report, Healthy Border 2020: A Prevention & Health Promotion Initiative, discusses the prevailing public health issues for U.S.-Mexico border populations and identifies persistent health conditions for this population as obesity, heart disease, diabetes, unintentional injuries, and tuberculosis. The report highlights the health concerns and conditions, particularly asthma, as a result of poor air quality from pollution, emissions, and other environmental particulates. The border region contains a type of settlement called colonias, which are defined by the U.S. Department of Housing and Urban Development (HUD) and USDA Rural Development as “rural communities within the US-Mexico border region that lack adequate water, sewer, or decent housing, or a combination of all three.” Other living conditions that impact health include unpaved roads that create dust, causing respiratory problems, as well as homes built in flood-prone areas that experience frequent flooding, which can contaminate the potable water systems. Border 2025: United States-Mexico Environmental Program, a 2021 report from the United States Environmental Protection Agency (EPA) and Mexico's Ministry of the Environment and Natural Resources, provides information on efforts to reduce air pollution, improve water quality and waste management, and update emergency preparedness plans. See Rural Project Examples: U.S.-Mexico Border Region for examples of other programs working to decrease disparities in the area.
Offering additional information on regional rural health disparities, the U.S. Health Map from IHME at the University of Washington is an interactive map that provides county-level data for the U.S. on life expectancy, mortality rates, mortality risks, and other health risk factors. Map data can be narrowed by sex and is available from 1980 through 2014. Health trend data by county is available for major causes of death, including several types of cancer, heart disease, stroke, chronic lung diseases, diabetes, unintentional injury, and mental and substance use disorders. IHME also publishes U.S. County Profiles data and maps on major causes of death by county for all 50 states.
Additionally, the University of Wisconsin Population Health Institute and the Robert Wood Johnson Foundation offer the County Health Rankings project, which provides annual data on county-level health disparities, as well as social and economic factors that influence health outcomes.
Where can I find supporting documents and statistics on rural health disparities?
Several publications identify and describe the rural health disparities that include urban comparisons.
- The 2016 study Exploring Rural and Urban Mortality Differences provides data tables and online tools displaying mortality rates for the 10 leading causes of death by rurality, age, region, and sex.
- The 2014 Update of the Rural-Urban Chartbook highlights health trends and disparities across different levels of metro and nonmetropolitan counties. The chartbook includes population characteristics, health-related behaviors and risk factors, mortality rates, and healthcare access and use. Individual data tables in the chartbook are available in an Excel file.
- The University of Minnesota Rural Health Research Center offers rural and urban comparisons of health-related data on older adults in their 2020 report Rural-Urban Differences among Older Adults.
- A National Healthcare Quality and Disparities Report is published annually by the Agency for Healthcare Research and Quality (AHRQ). This report provides a comprehensive national overview of disparities in healthcare among demographic groups, and other factors in the U.S. population and rural areas. The report also tracks the success of activities to reduce disparities.
- Also published by AHRQ, the Chartbook on Rural Healthcare offers a summary of trends across various rural healthcare measures and includes figures of specific measures. A slide deck is also available for users to download for presentation.
- Health, United States presents an annual overview of national trends in health statistics. The report covers health status and determinants, healthcare utilization, access, and expenditures. To view rural data in the Data Finder, select "Metropolitan and nonmetropolitan" under Population Subgroups.
- The Rural Health Research Gateway provides access to publications and projects developed by FORHP-funded rural health research centers, including research on a variety of topics related to rural health disparities.
- The 2024 report Rural-Urban Disparities in Health Care in Medicare examines differences and disparities in the quality of Medicare services for rural and urban populations, and includes rural health disparity data.
- The Rural Border Health Chartbook, published by the University of South Carolina Rural Health Research Center in 2021, presents a variety of health indicators and social determinants of health that contribute to health disparities in rural and urban areas of the U.S.-Mexico border region. The chartbook offers data for residents in Arizona, California, New Mexico, and Texas demographic group, including rural-urban designation and proximity to the border. The data collected in the chartbook may be useful for public health officials, policymakers, and other organizations looking to address health disparities in the region.
For additional information on rural/urban health disparities see What sources cover health behaviors and health status for rural areas or by county? on our Finding Statistics and Data Related to Rural Health topic guide.
What agencies and organizations are working to seek solutions to these disparities?
- The Federal Office of Rural Health Policy (FORHP) is part of the Health Resources and Services Administration (HRSA) under the U.S. Department of Health and Human Services and promotes better healthcare services in rural America. FORHP focuses on matters affecting rural hospitals and healthcare, coordinates activities within the department related to rural healthcare, maintains a national information clearinghouse, and provides rural-specific grant programs to address many of the disparities affecting rural health.
- The Agency for Healthcare Research and Quality (AHRQ) sponsors and conducts research investigating healthcare outcomes and quality as well as cost, use, and access. AHRQ publishes an annual National Healthcare Quality and Disparities Report which summarizes healthcare quality and access in the U. S. among priority populations including people with disabilities; rural populations; and racial, ethnic, and socioeconomic groups.
- The National Institute on Minority Health and Health Disparities (NIMHD) leads scientific research to improve minority health and eliminate health disparities.
- The National Rural Health Association (NRHA) promotes leadership, ideas, information, communication, education, research, advocacy, and methods to improve rural health and reduce health disparities. NRHA is composed of individual and organizational members who share a common interest in rural health.
- The Robert Wood Johnson Foundation (RWJF) supports research and programs devoted to health and healthcare. RWJF engages policymakers, business leaders, and community groups to establish a national agenda for improving population health.
- Rural Health Research Centers are funded by the Federal Office of Rural Health Policy to produce policy-relevant research and analysis on healthcare and issues impacting healthcare in rural areas. Research findings are also used to inform a wide audience of national, state, and local decision-makers concerned with rural health.
- The National Cancer Institute Center to Reduce Cancer Health Disparities (CRCHD) conducts research on cancer health disparities. CRCHD works to support cancer programs and inform policy to improve cancer health disparities research activities.
For additional information on rural health research see the Conducting Rural Health Research, Needs Assessments, and Program Evaluations topic guide.
Where can I find programs that illustrate best practices to meet the challenges of providing health services in areas characterized by disparities?
Our Rural Health Models and Innovations features examples of programs and interventions that have shown success in providing health services in rural areas experiencing health disparities. Models and innovations can be searched by evidence level, topic, source, and state. A few examples of successful programs include:
- Kentucky Homeplace is a CHW initiative focused on reducing health disparities in rural Kentucky. The model emphasizes coordinating care and health coaching while providing many healthcare services at no cost to the patient.
- Health Extension Rural Offices (HEROs) is a program that created local community offices and community agents to help community members identify their health and social needs and help them connect with the University of New Mexico Health Sciences Center (UNMHSC) and related resources.
Annually, RWJF recognizes communities working to improve population health, including rural and tribal communities, with the Culture of Health Prize. To browse past Culture of Health Prize winners and read their stories, see the Meet the Culture of Health Prize Winners section of the Culture of Health Prize page.
We also maintain a listing of Other Case Studies and Collections of Program Examples that use their own criteria for selecting program examples. These examples can also be searched by resource type and topic.